Sensors#
Sensors allow you to instigate runs based on any external state change.
Relevant APIs#
| Name | Description |
|---|---|
@sensor | The decorator used to define a sensor. The decorated function is called the evaluation_fn. The decorator returns a SensorDefinition |
RunRequest | The sensor evaluation function can yield one or more run requests. Each run request creates a pipeline run. |
SkipReason | If a sensor evalauation doesn't yield any run requests, it can instead yield a skip reason to log why the evalation was skipped or why there were no events to be processed. |
SensorDefinition | Base class for sensors. You almost never want to use initialize this class directly. Instead, you should use the @sensor which returns a SensorDefinition |
Overview#
Sensors are definitions in Dagster that allow you to instigate runs based on some external state change automatically. For example, you can:
- Launch a run whenever a file appears in an s3 bucket
- Launch a run whenever another pipeline materializes a specific asset
- Launch a run whenever an external system is down
Sensors have several important properties:
- Each sensor targets a specific pipeline
- A sensor optionally defines tags, a mode, and a solid selection for the targeted pipeline.
- A sensor defines an evaluation function that returns either:
- One or more
RunRequestobjects. Each run request launches a run. - An optional
SkipReason, which specifies a message which describes why no runs were requested.
- One or more
The Dagster Daemon runs each sensor evaluation function on a tight loop. If you are using sensors, make sure to follow the instructions on the DagsterDaemon page to run your sensors.
Defining a sensor#
To define a sensor, use the @sensor decorator. The decorated function is called the execution_fn and must have context as the first argument. The context is a SensorExecutionContext
Let's say you have a pipeline that logs a filename that is specified in the solid configuration of the process_file solid:
from dagster import solid, pipeline


@solid(config_schema={"filename": str})
def process_file(context):
    filename = context.solid_config["filename"]
    context.log.info(filename)


@pipeline
def log_file_pipeline():
    process_file()
You can write a sensor that watches for new files in a specific directory and yields a RunRequest for each new file in the directory. By default, this sensor every 30 seconds.
import os
from dagster import sensor, RunRequest


@sensor(pipeline_name="log_file_pipeline")
def my_directory_sensor(_context):
    for filename in os.listdir(MY_DIRECTORY):
        filepath = os.path.join(MY_DIRECTORY, filename)
        if os.path.isfile(filepath):
            yield RunRequest(
                run_key=filename,
                run_config={"solids": {"process_file": {"config": {"filename": filename}}}},
            )
This sensor iterates through all the files in MY_DIRECTORY and yields a RunRequest for each file.
Idempotence and Cursors#
When instigating runs based on external events, you usually want to run exactly one pipeline run for each event. There are two ways to define your sensors to avoid creating duplicate runs for your events: using run_key and using a cursor.
Idempotence using run keys#
In the example sensor above, the RunRequest is constructed with a run_key.
yield RunRequest(
        run_key=filename,
        run_config={"solids": {"process_file": {"config": {"filename": filename}}}},
    )
Dagster guarantees that for a given sensor, at most one run is created for each RunRequest with a unique run_key. If a sensor yields a new run request with a previously used run_key, Dagster skips processing the new run request.
In the example, a RunRequest is requested for each file during every sensor evaluation. Therefore, for a given sensor evaluation, there already exists a RunRequest with a run_key for any file that existed during the previous sensor evaluation. Dagster skips processing duplicate run requests, so Dagster launches runs for only the files added since the last sensor evaluation. The result is exactly one run per file.
Run keys allow you to write sensor evaluation functions that declaratively describe what pipeline runs should exist, and helps you avoid the need for more complex logic that manages state. However, when dealing with high-volume external events, some state-tracking optimizations might be necessary.
Sensor optimizations using cursors#
When writing a sensor that deals with high-volume events, it might not be feasible to yield a RunRequest during every sensor evaluation. For example, you may have an s3 storage bucket that contains thousands of files.
When writing a sensor for such event sources, you can maintain a cursor to limit yielding run requests for previously processed events. The sensor API can maintain two types of cursors:
last_completion_time: A cursor that returns the .... of the last run requested by the previous sensor evaluation.last_run_key: A cursor that returns the run key of the last run requested by the previous sensor evaluation.
A SensorExecutionContext is passed to the sensor evalation function and contains both of these cursors.
Evaluation Interval#
By default, the Dagster Daemon runs a sensor 30 seconds after the previous sensor evaluation finishes executing. You can configure the interval using the minimum_interval_seconds argument on the @sensor decorator.
It's important to note that this interval represents a minimum interval between runs of the sensor and not the exact frequency the sensor runs. If you have a sensor that takes 2 minutes to complete, but the minimum_interval_seconds is 5 seconds, the fastest Dagster Daemon will run the sensor is every 2 minutes and 5 seconds. The minimum_interval_seconds only guarantees that the sensor is not evaluated more frequently than the given interval.
For example, here are two sensors that specify two different minimum intervals:
@sensor(pipeline_name="my_pipeline", minimum_interval_seconds=30)
def sensor_A(_context):
    yield RunRequest(run_key=None, run_config={})


@sensor(pipeline_name="my_pipeline", minimum_interval_seconds=45)
def sensor_B(_context):
    yield RunRequest(run_key=None, run_config={})
These sensor definitions are short, so they run in less than a second. Therefore, you can expect these sensors to run consistently around every 30 and 45 seconds, respectively.
Skipping sensor evaluations#
Testing sensors#
Monitoring sensors in Dagit#
You can monitor and operate sesors in Dagit. There are multiple views that help with observing sensor evaluations, skip reasons, and errors.
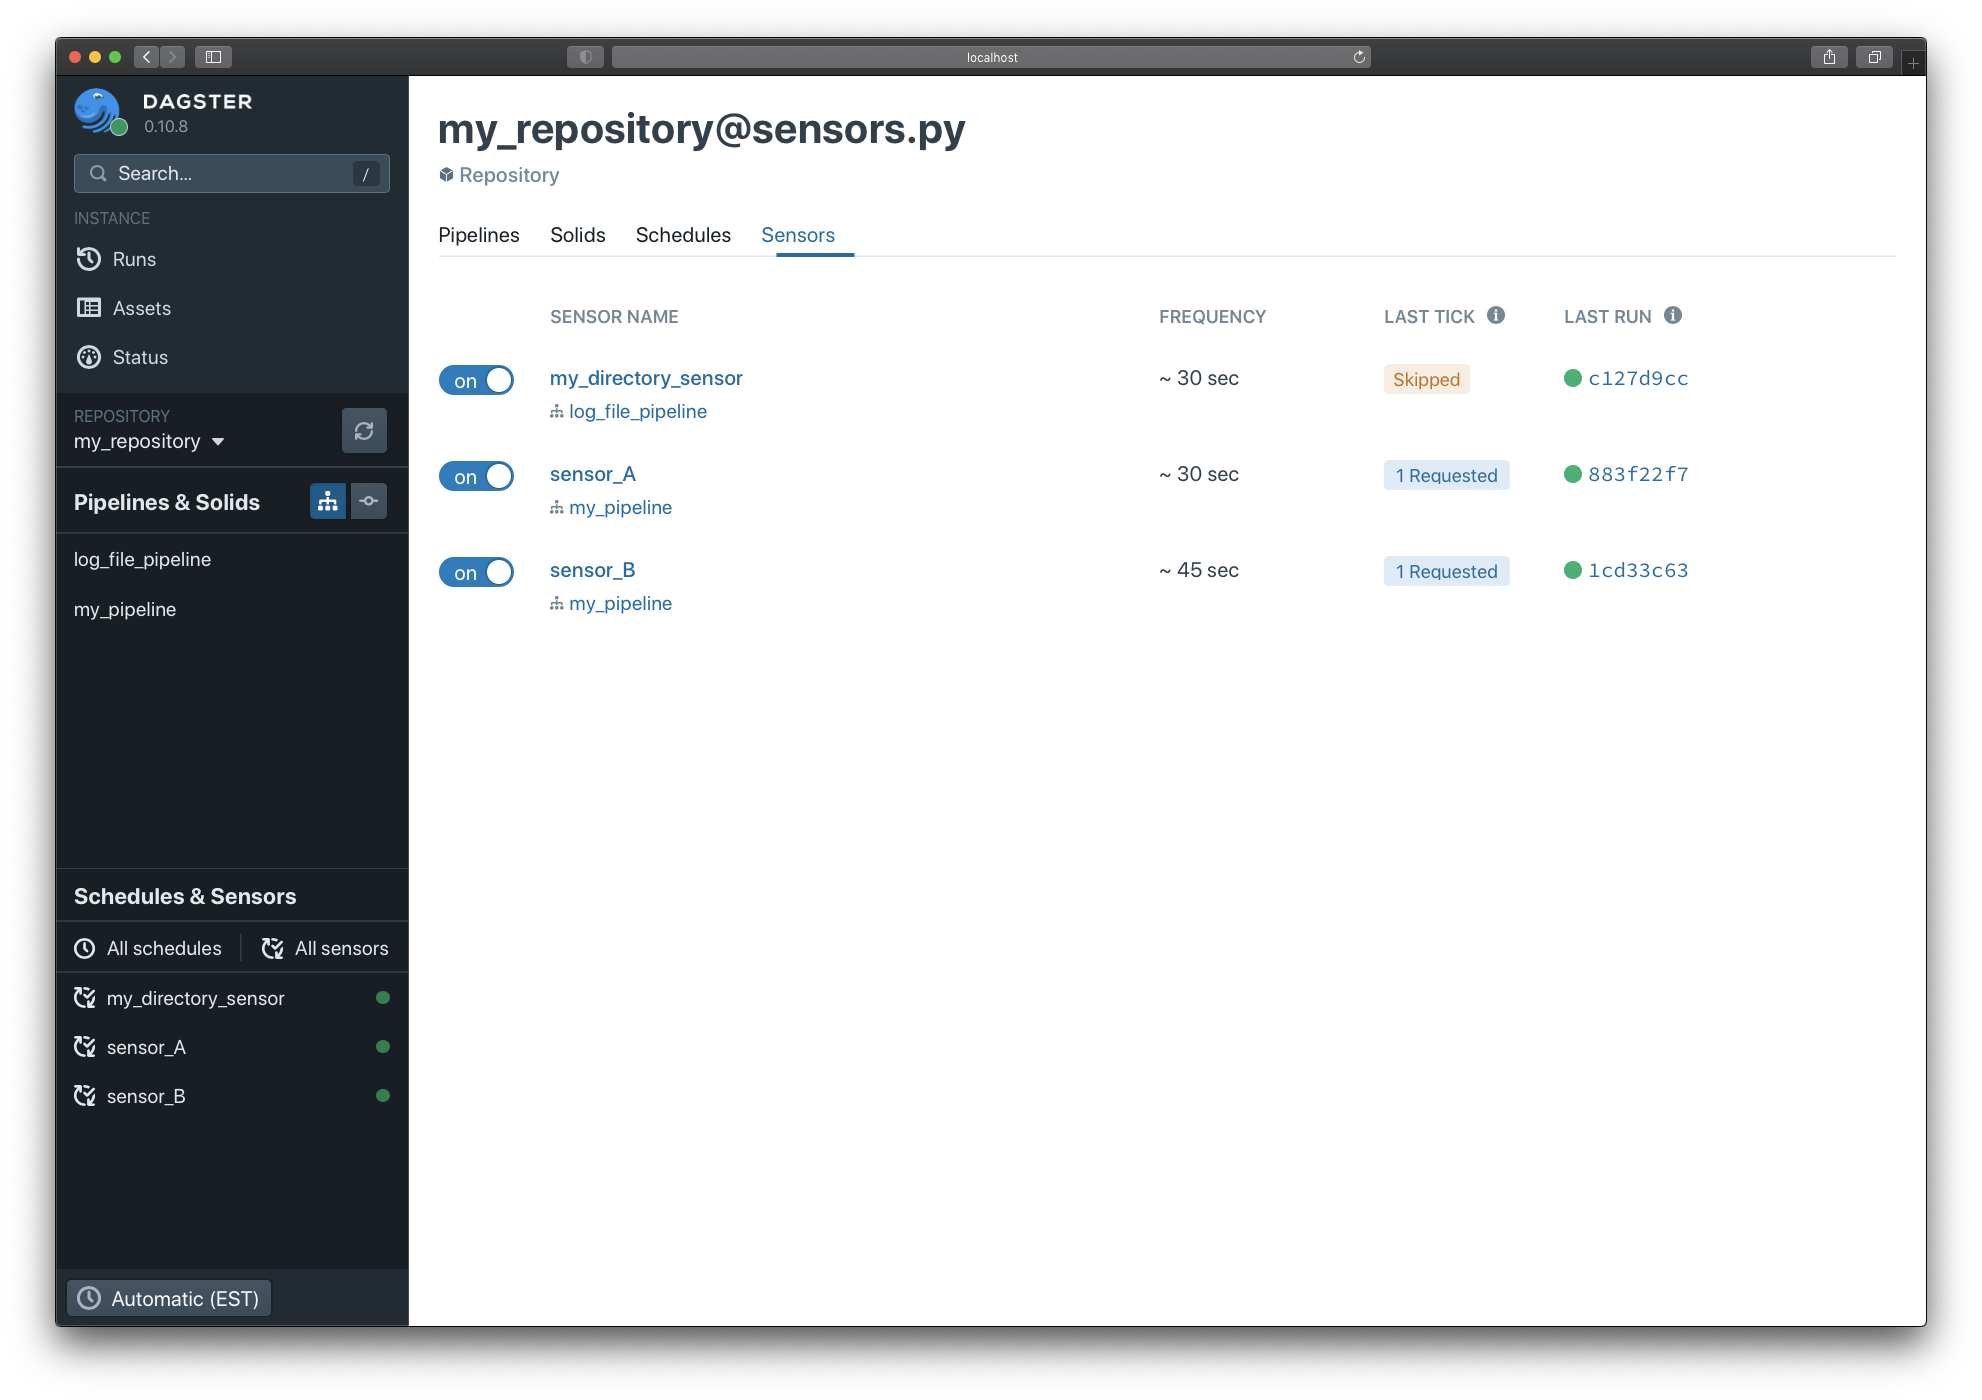
To view the sensors page, click the "All sensors" in the left-hand navigation pane. Here you can turn sensors on and off using the toggle.

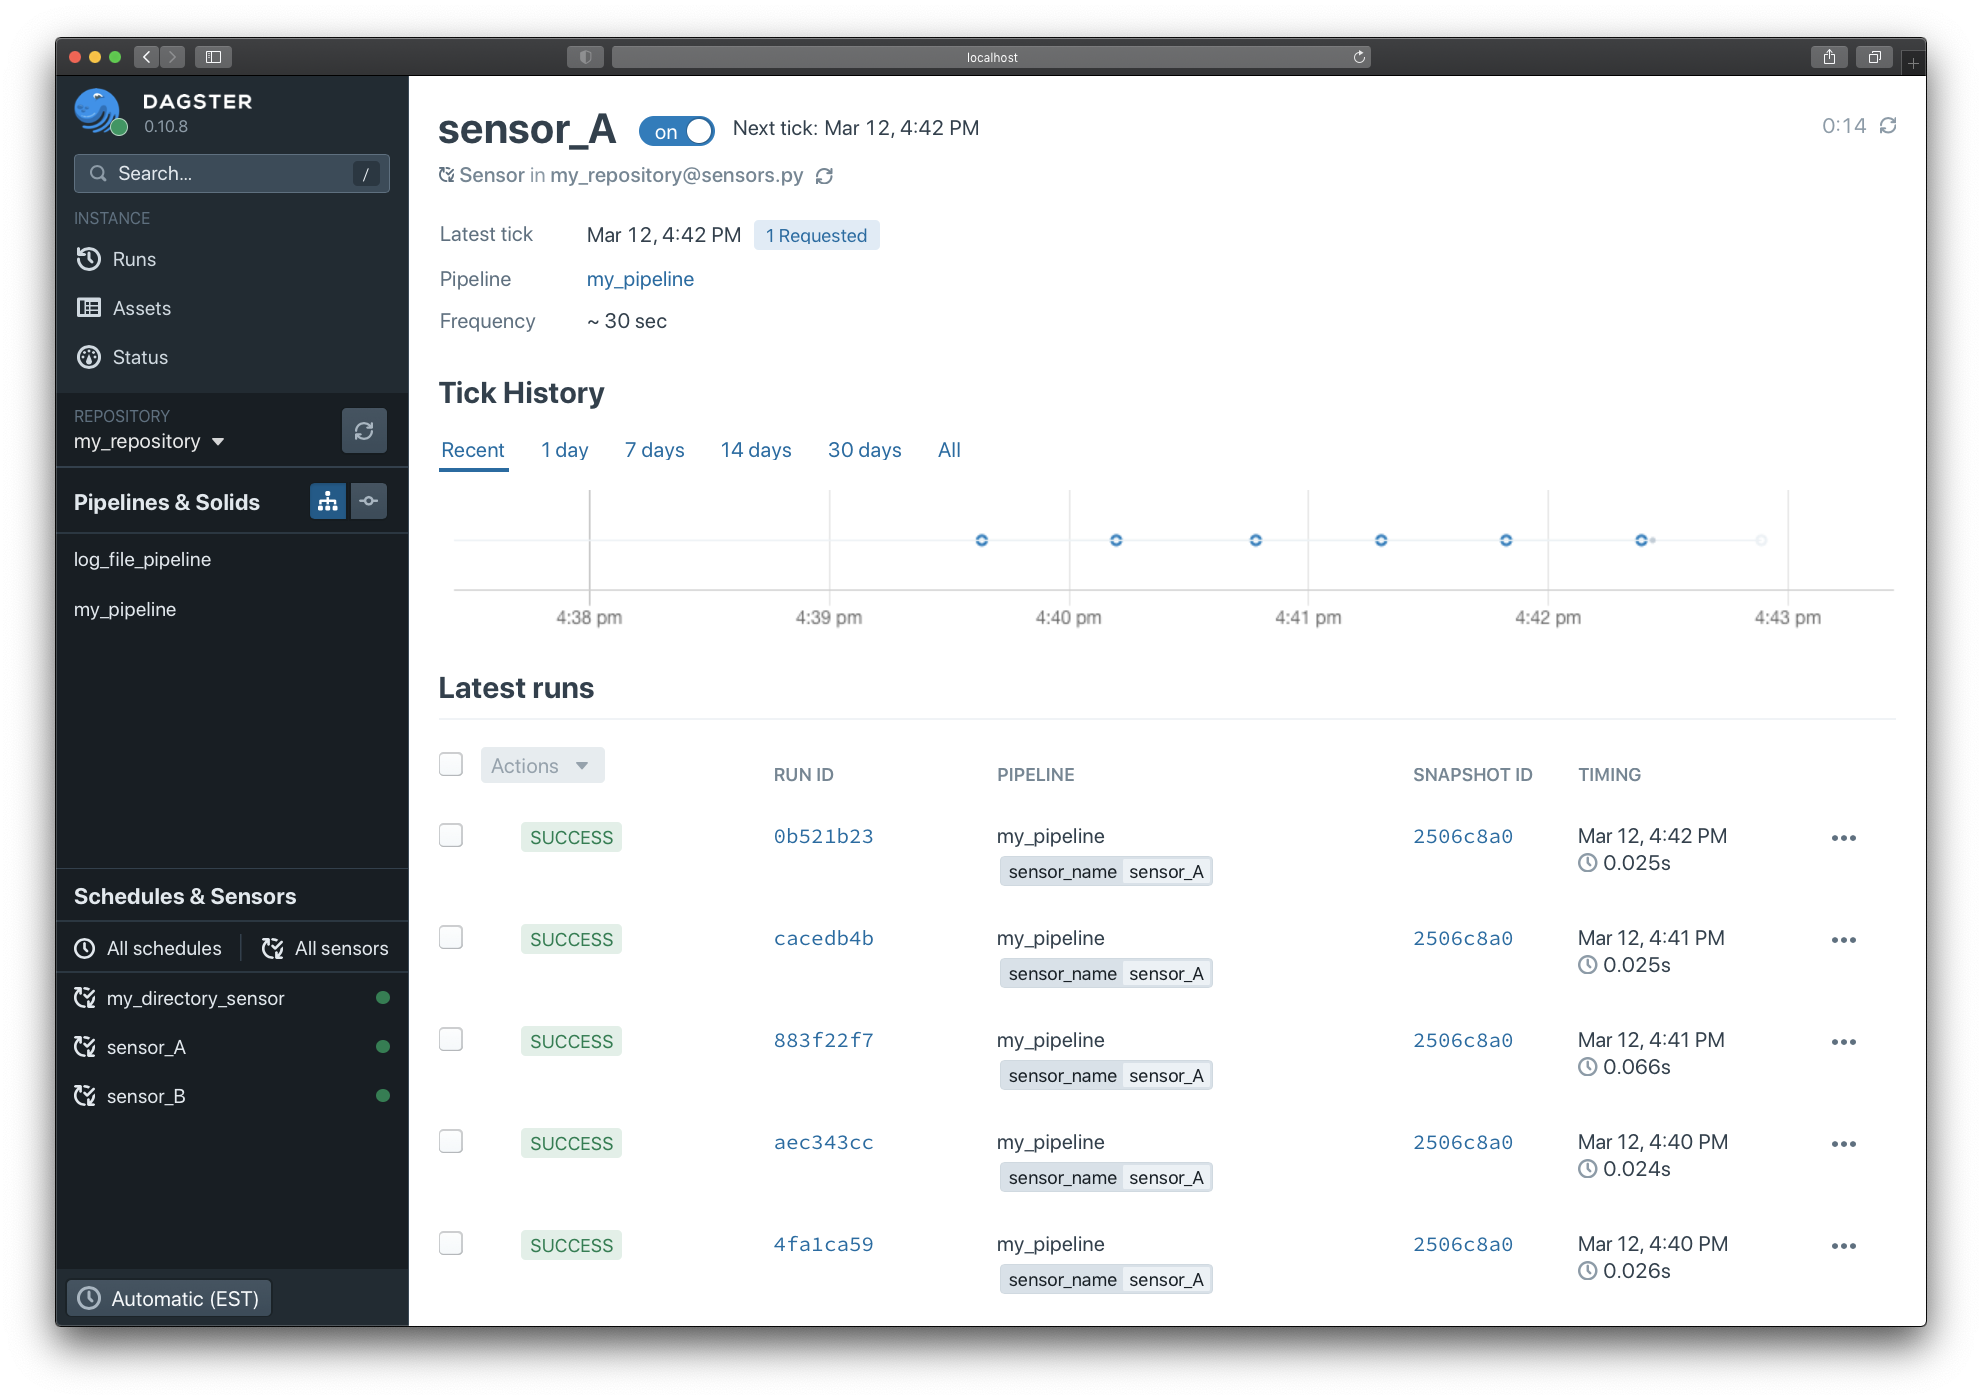
If you click on any sensor, you can monitor all sensor evaluations and runs created:

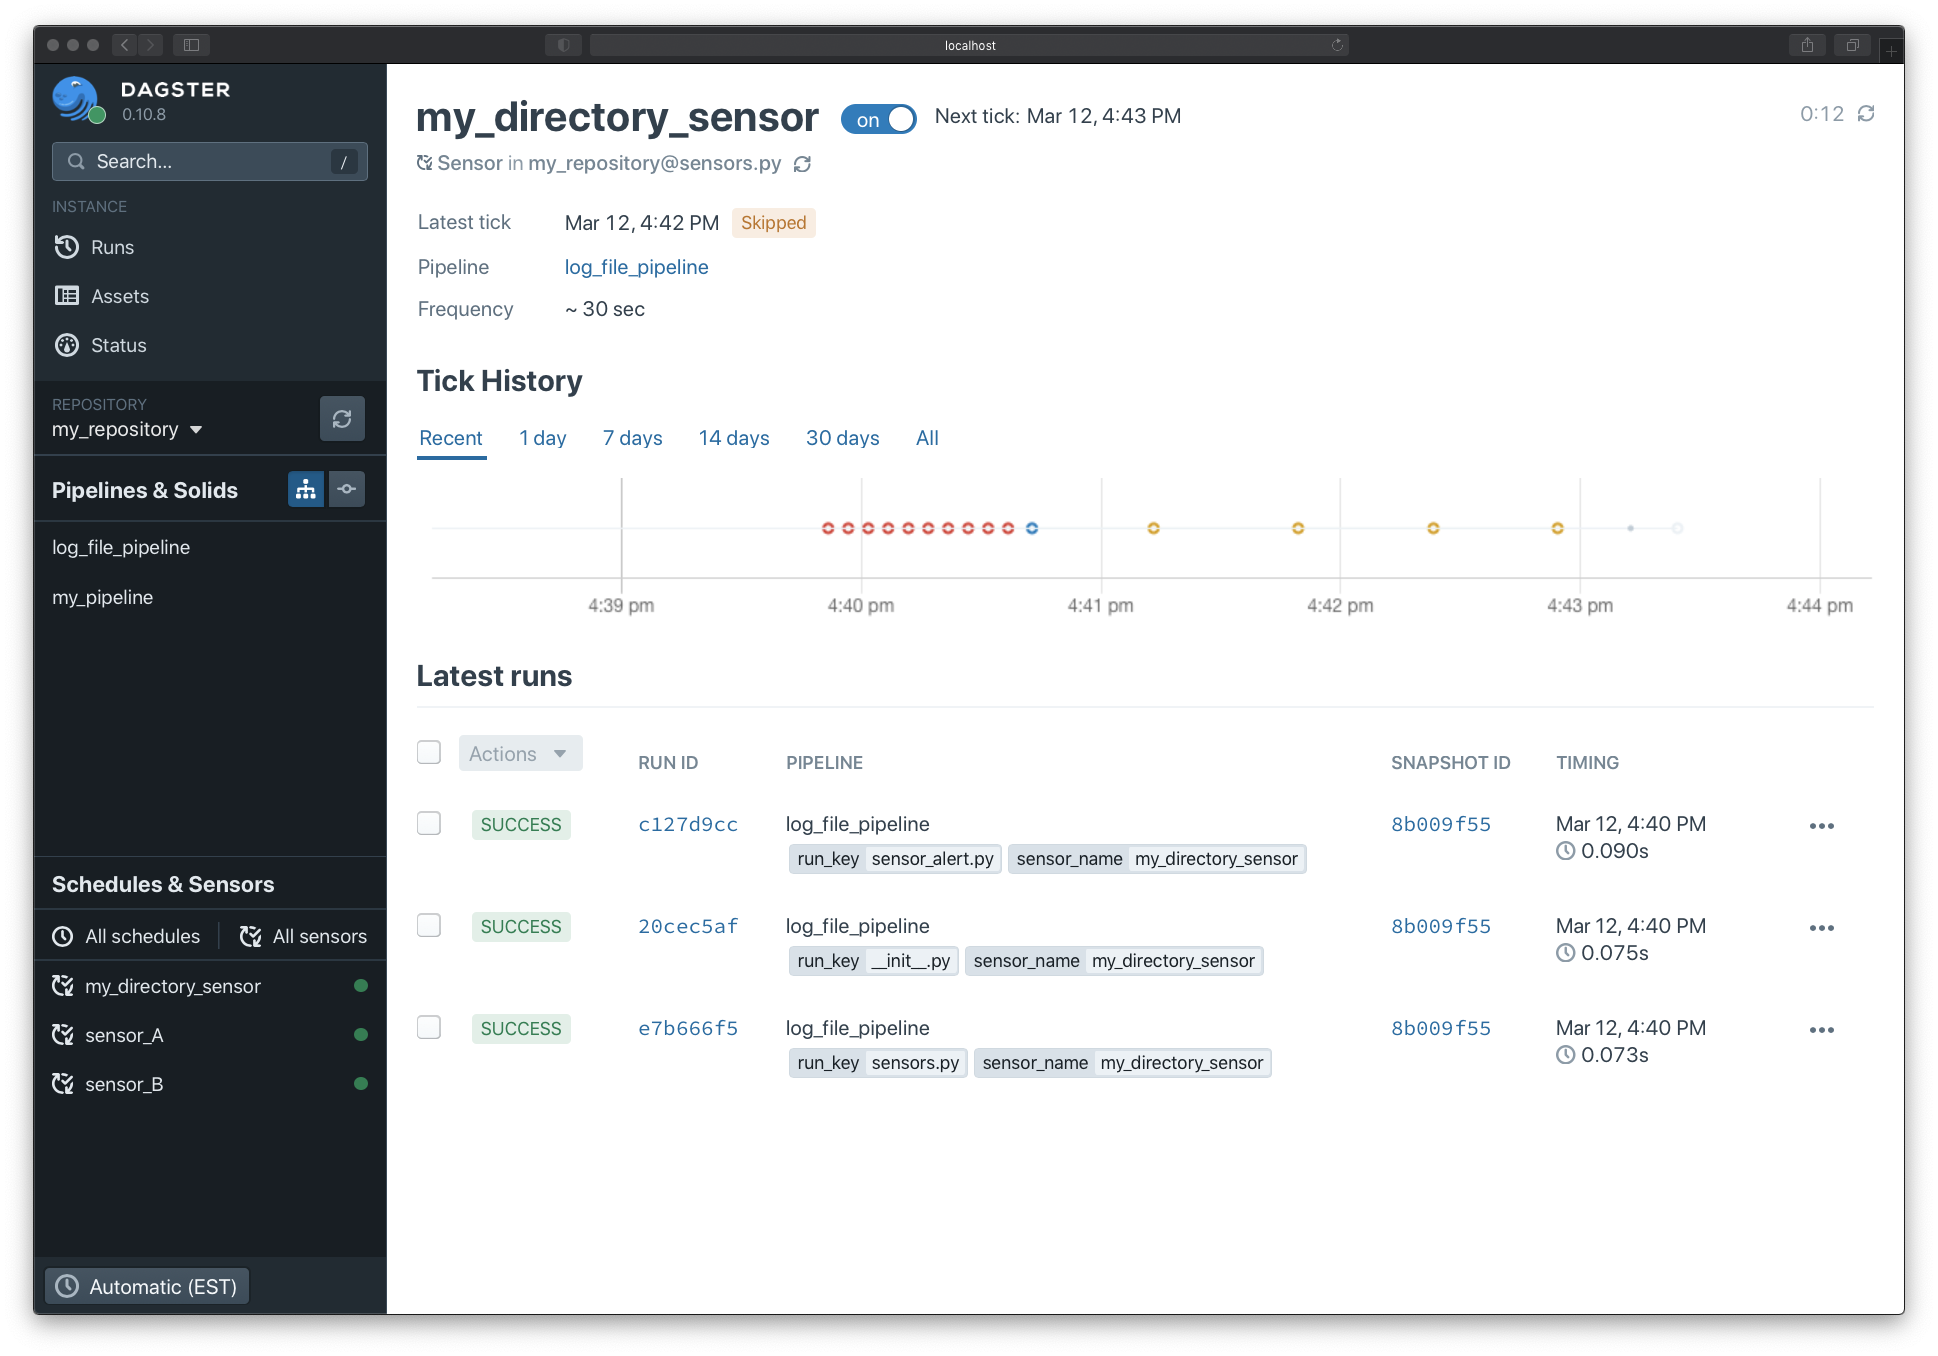
If your sensor throws an error or yields a skip reason, the sensor timeline view will display more information about the errors and skips:

Examples#
Asset sensor#
Cross-DAG sensor#
Pipeline failure sensor#
If you want to act on pipeline failures, e.g., you need to send an alert to a monitoring service on pipeline failure. You can write a sensor that monitors Dagster's runs table and launches a specialized "alert" pipeline for each failed run.
For example, you can write an "alert" pipeline that sends a slack message when it runs. Note that the pipeline depends on a slack resource:
@solid(required_resource_keys={"slack"})
def slack_message_on_failure_solid(context):
    message = f"Solid {context.solid.name} failed"
    context.resources.slack.chat.post_message(channel="#foo", text=message)


@pipeline(
    mode_defs=[
        ModeDefinition(name="test", resource_defs={"slack": ResourceDefinition.mock_resource()}),
        ModeDefinition(name="prod", resource_defs={"slack": slack_resource}),
    ]
)
def failure_alert_pipeline():
    slack_message_on_failure_solid()
Then, you can define a sensor that fetches the failed runs from the runs table via context.get_instance(), and instigates a failure_alert_pipeline run for every failed run. Note that we use the failed run's id as the run_key to prevent sending an alert twice for the same pipeline run.
@sensor(pipeline_name="failure_alert_pipeline", mode="prod")
def pipeline_failure_sensor(context):
    with context.get_instance() as instance:
        runs = instance.get_runs(
            filters=PipelineRunsFilter(
                pipeline_name="your_pipeline_name",
                statuses=[PipelineRunStatus.FAILURE],
            ),
        )
        for run in runs:
            # Use the id of the failed run as run_key to avoid duplicate alerts.
            yield RunRequest(run_key=str(run.run_id))
If you would like to set up success or failure handling policies on solids, you can find more information on the Solid Hooks page.