Dagit UI#
Dagit is a web-based interface for viewing and interacting with Dagster objects.
Through it, you can inspect solid and pipeline definitions, launch runs, view launched runs, and view assets produced by those runs.
To launch the Dagit web server, run dagit. The command will print out the URL you can access the
interface from in the browser, usually on port 3000.
Dagit fetches definitions - pipelines, solids, schedules, partition sets - from a set of
repositories configured in a workspace.yaml. It fetches runs from a run storage, configured in
an instance's dagster.yaml. It fetches assets from an asset storage, also configured in an
instance's dagster.yaml.
These are the main pages inside Dagit:
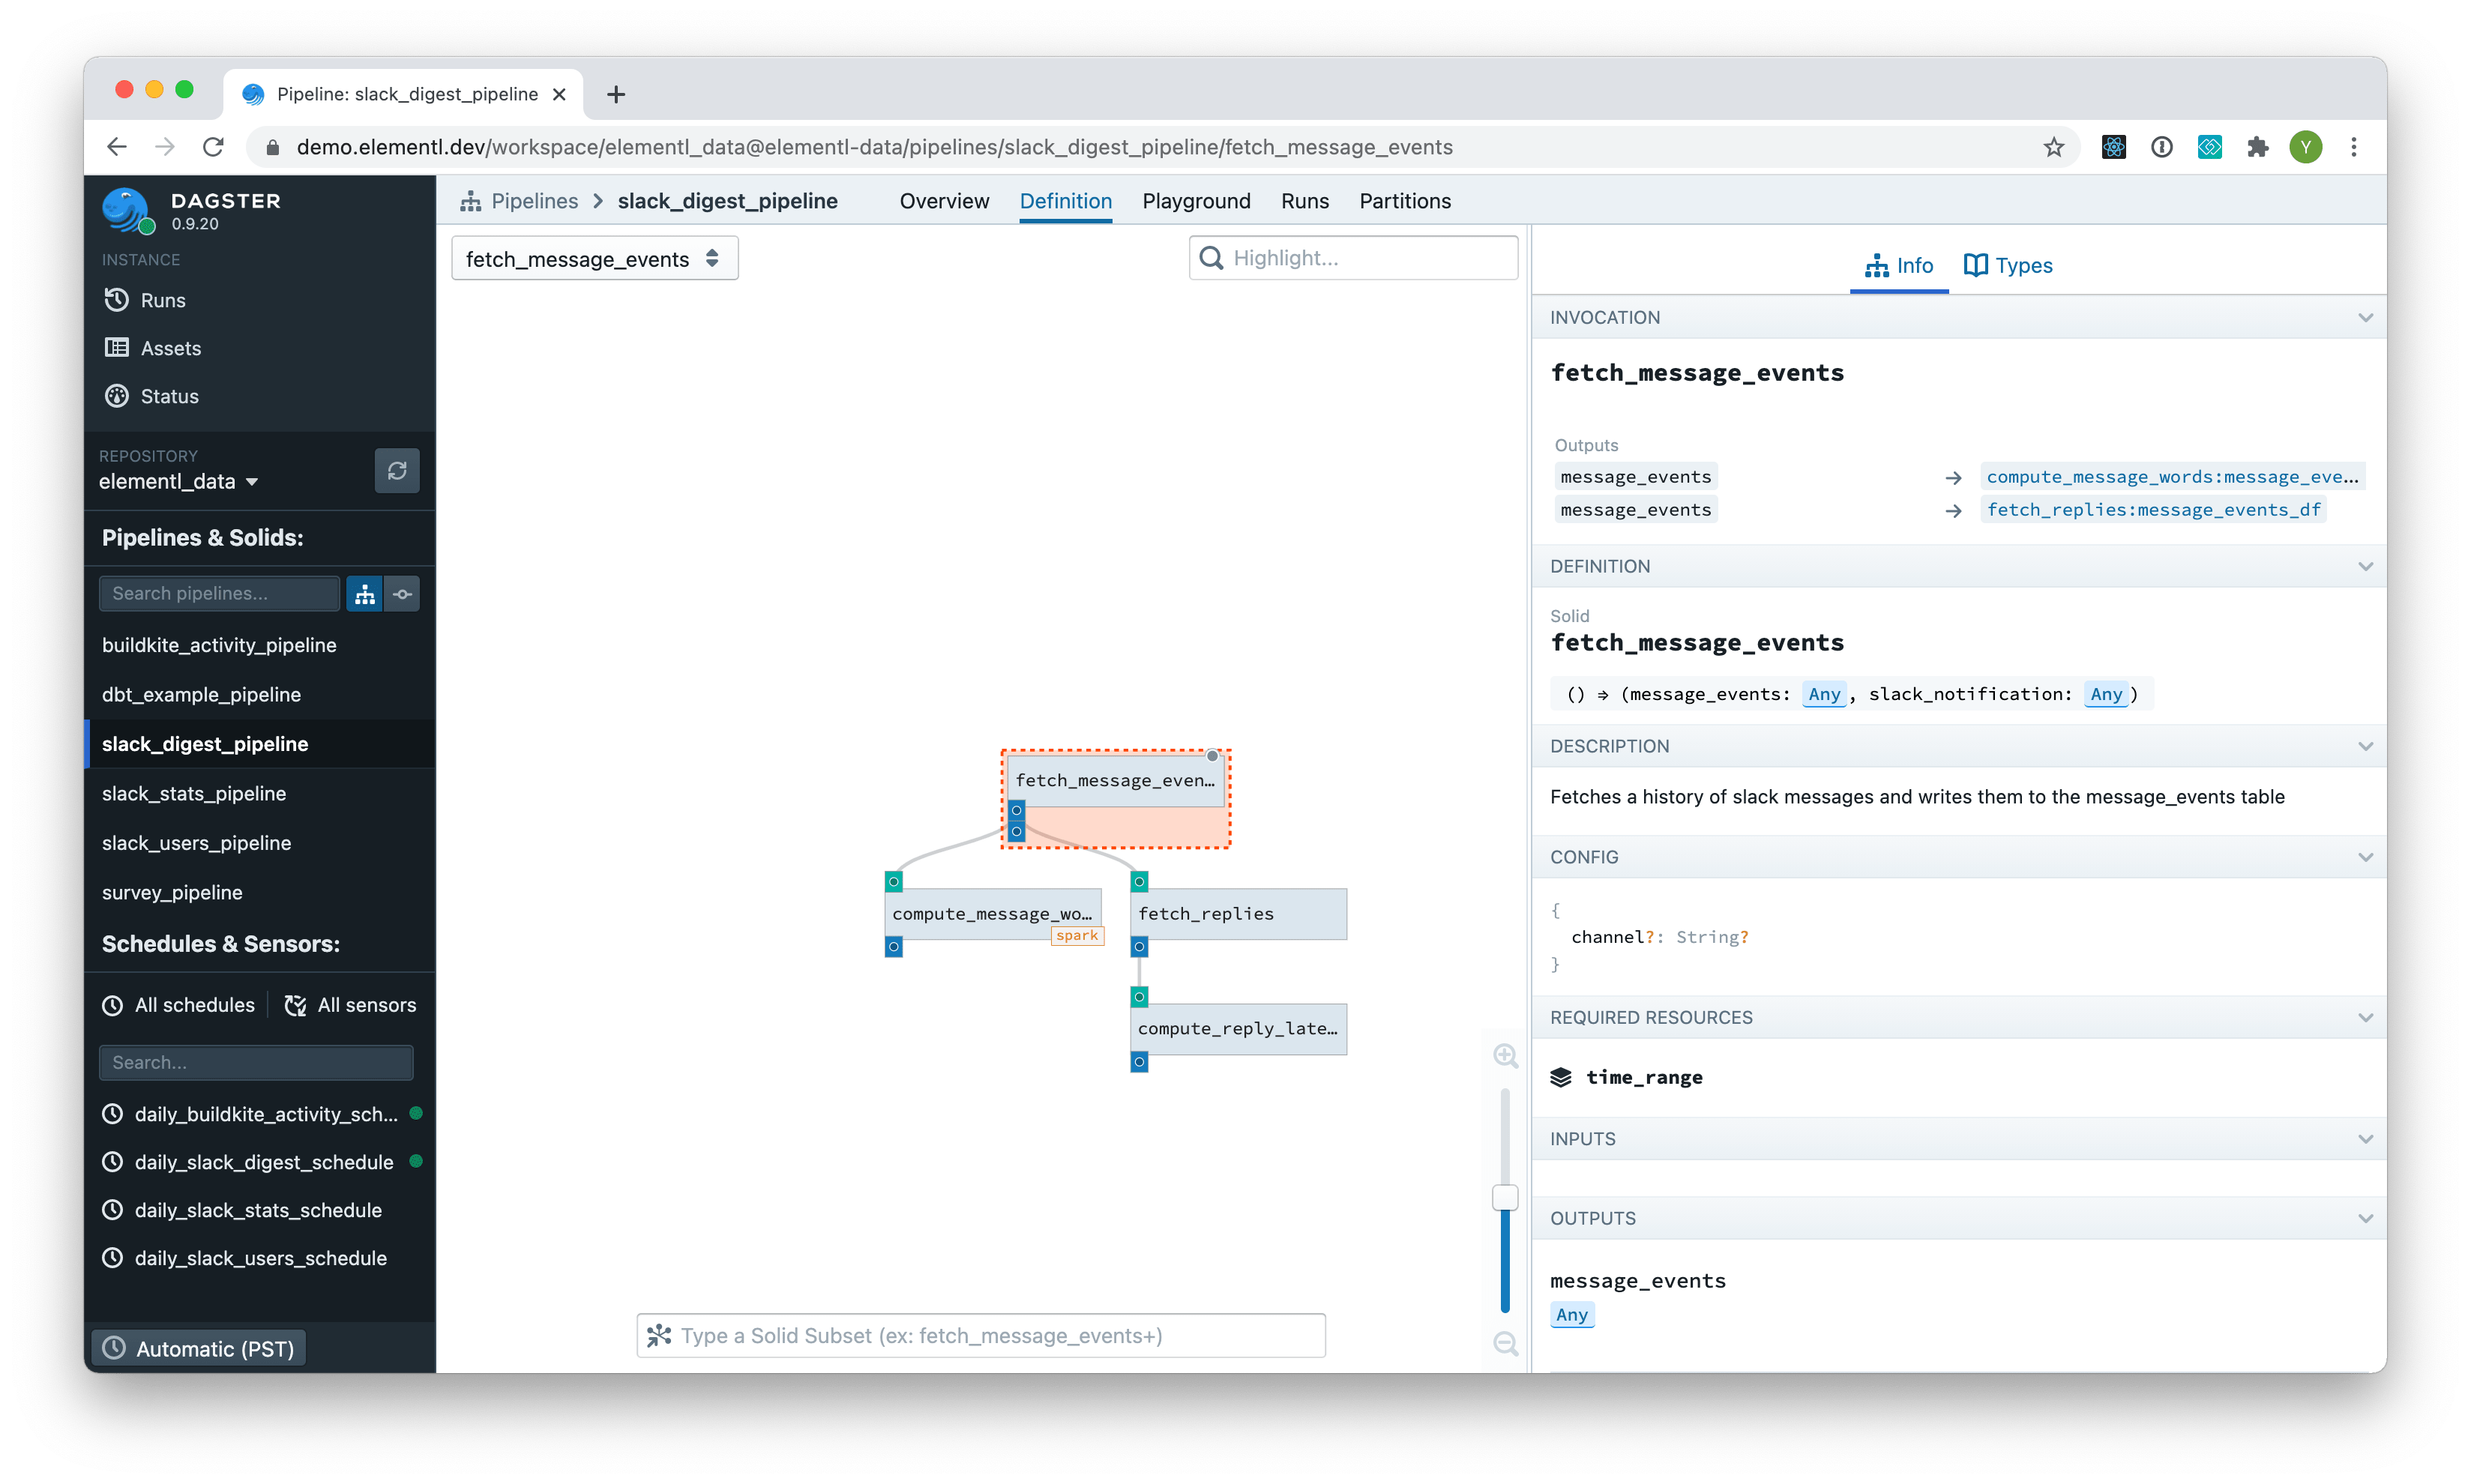
Pipeline#
The Pipeline page lets you explore a pipeline definition, launch a pipeline run, and examine a pipeline run.
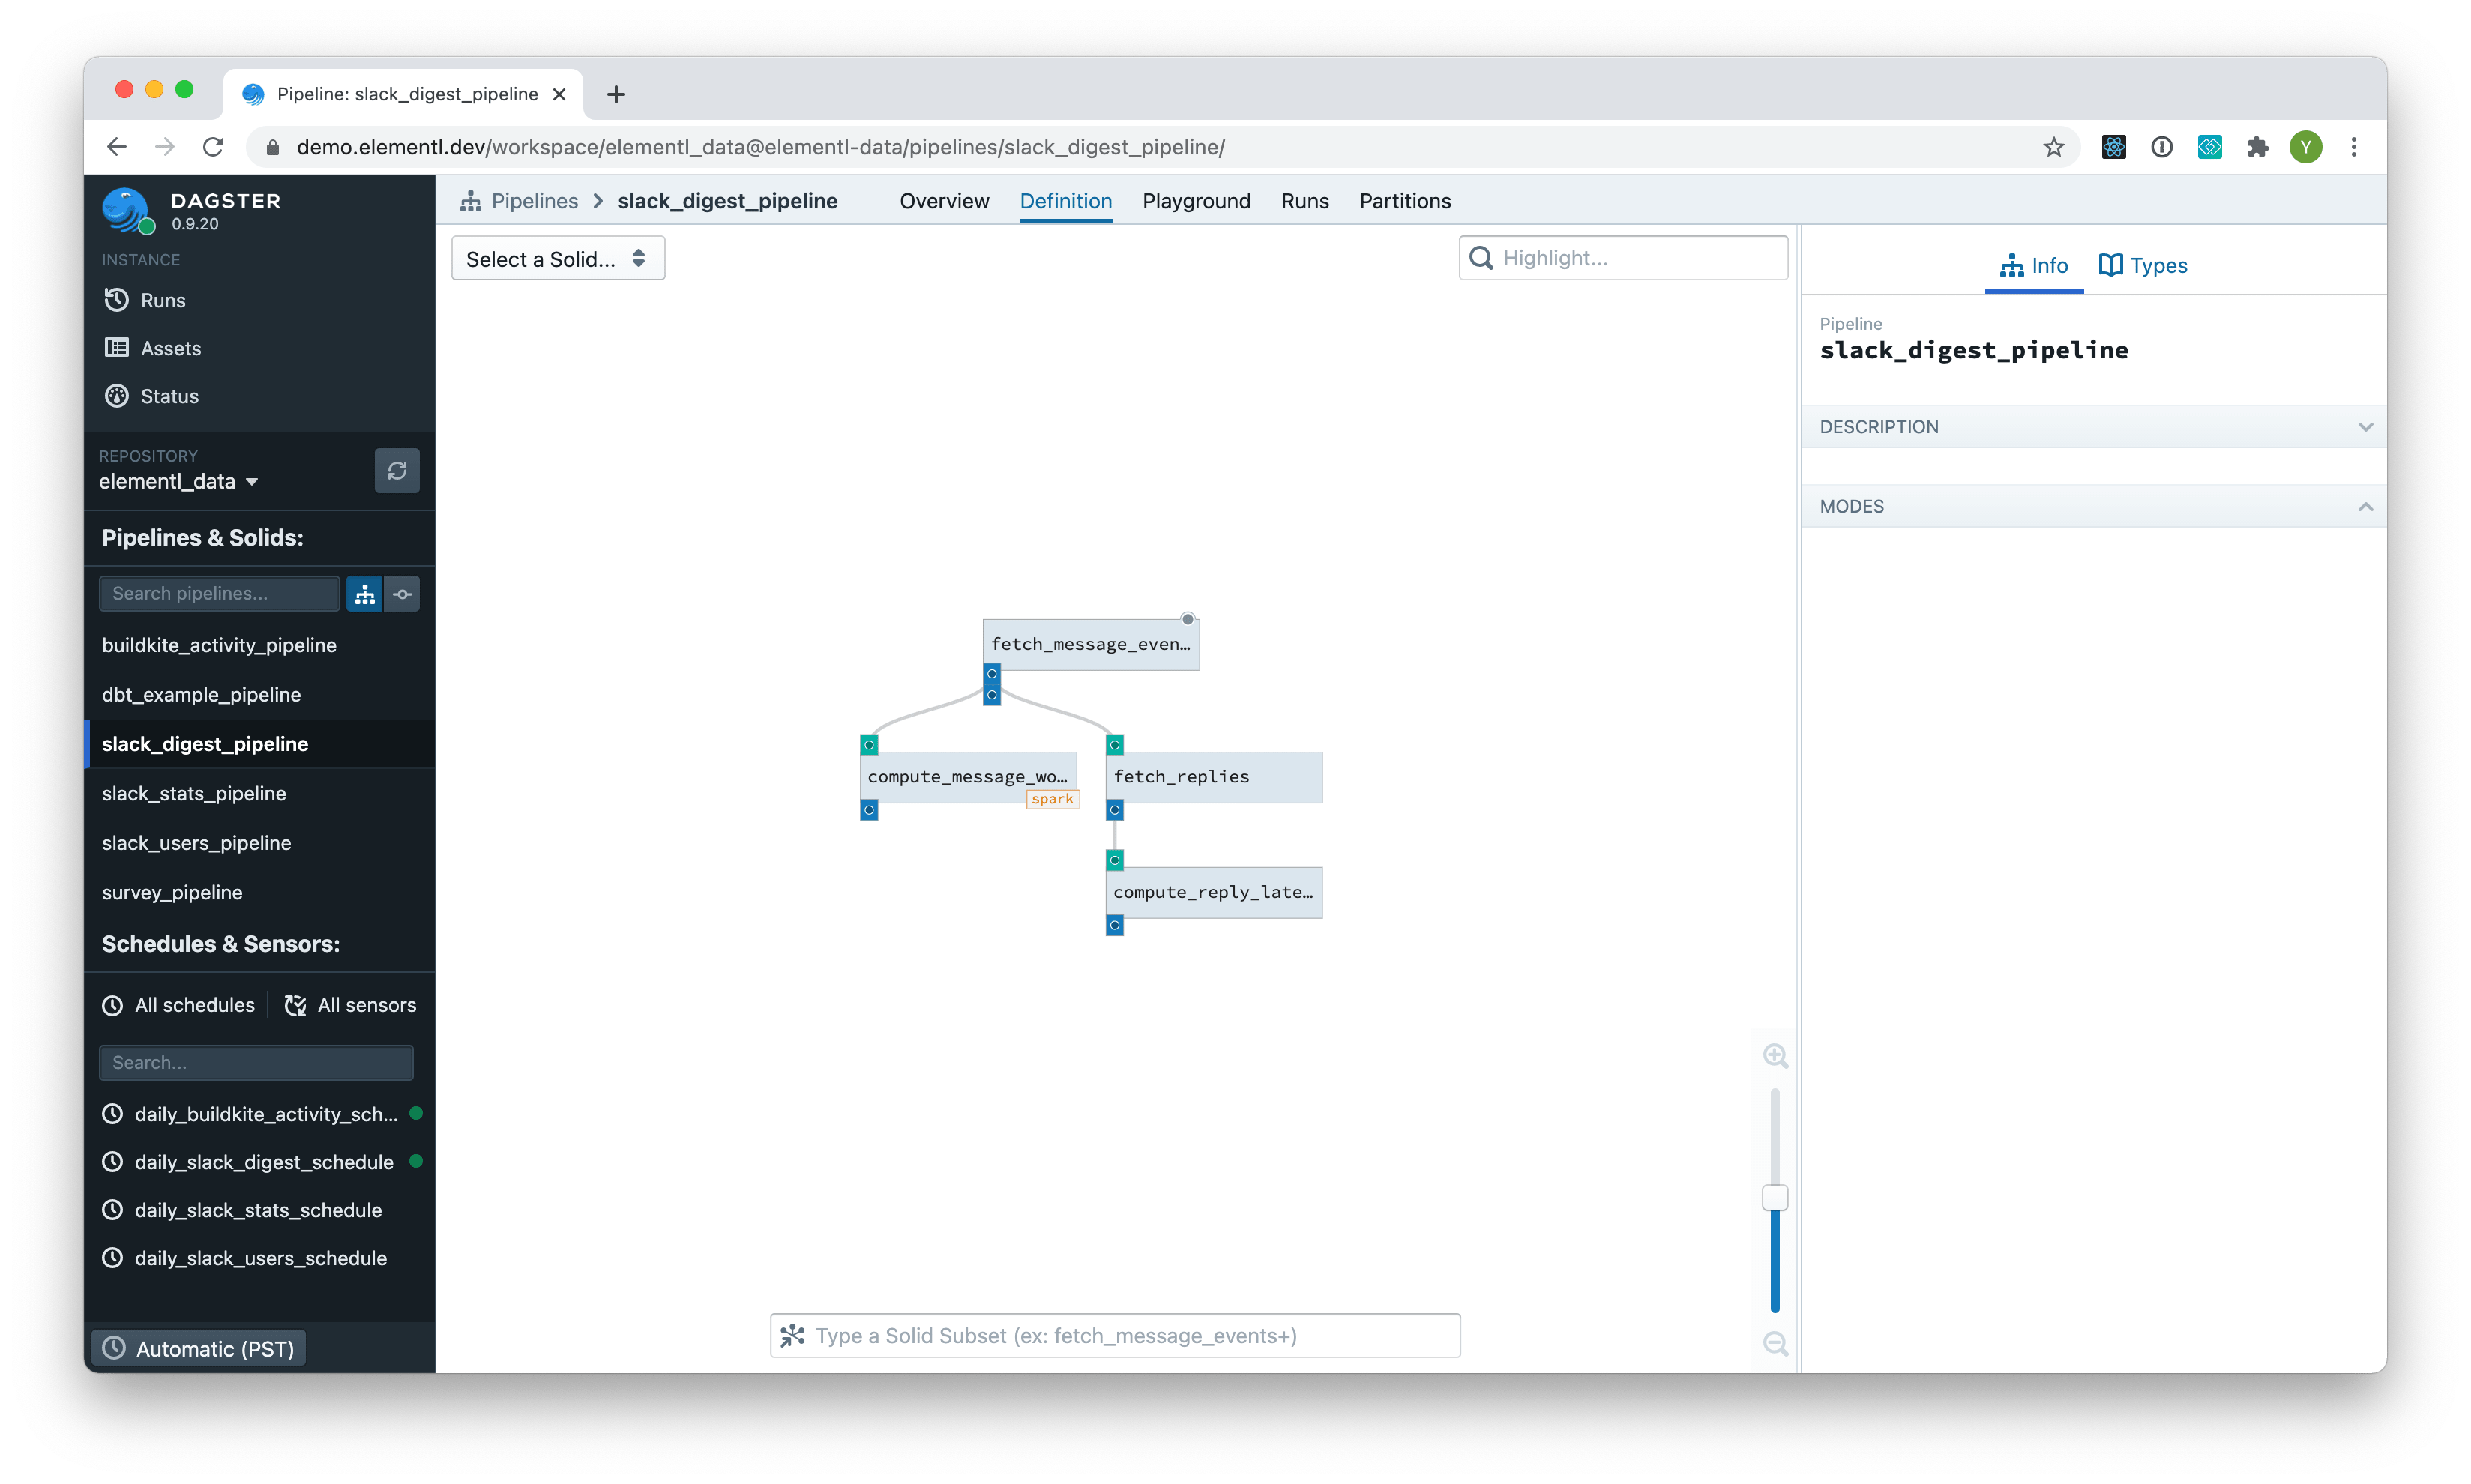
Pipeline definition#
The Definition tab in the pipeline page shows the topology of solids that make up a pipeline. Selecting a solid reveals detailed metadata about it in the right pane.
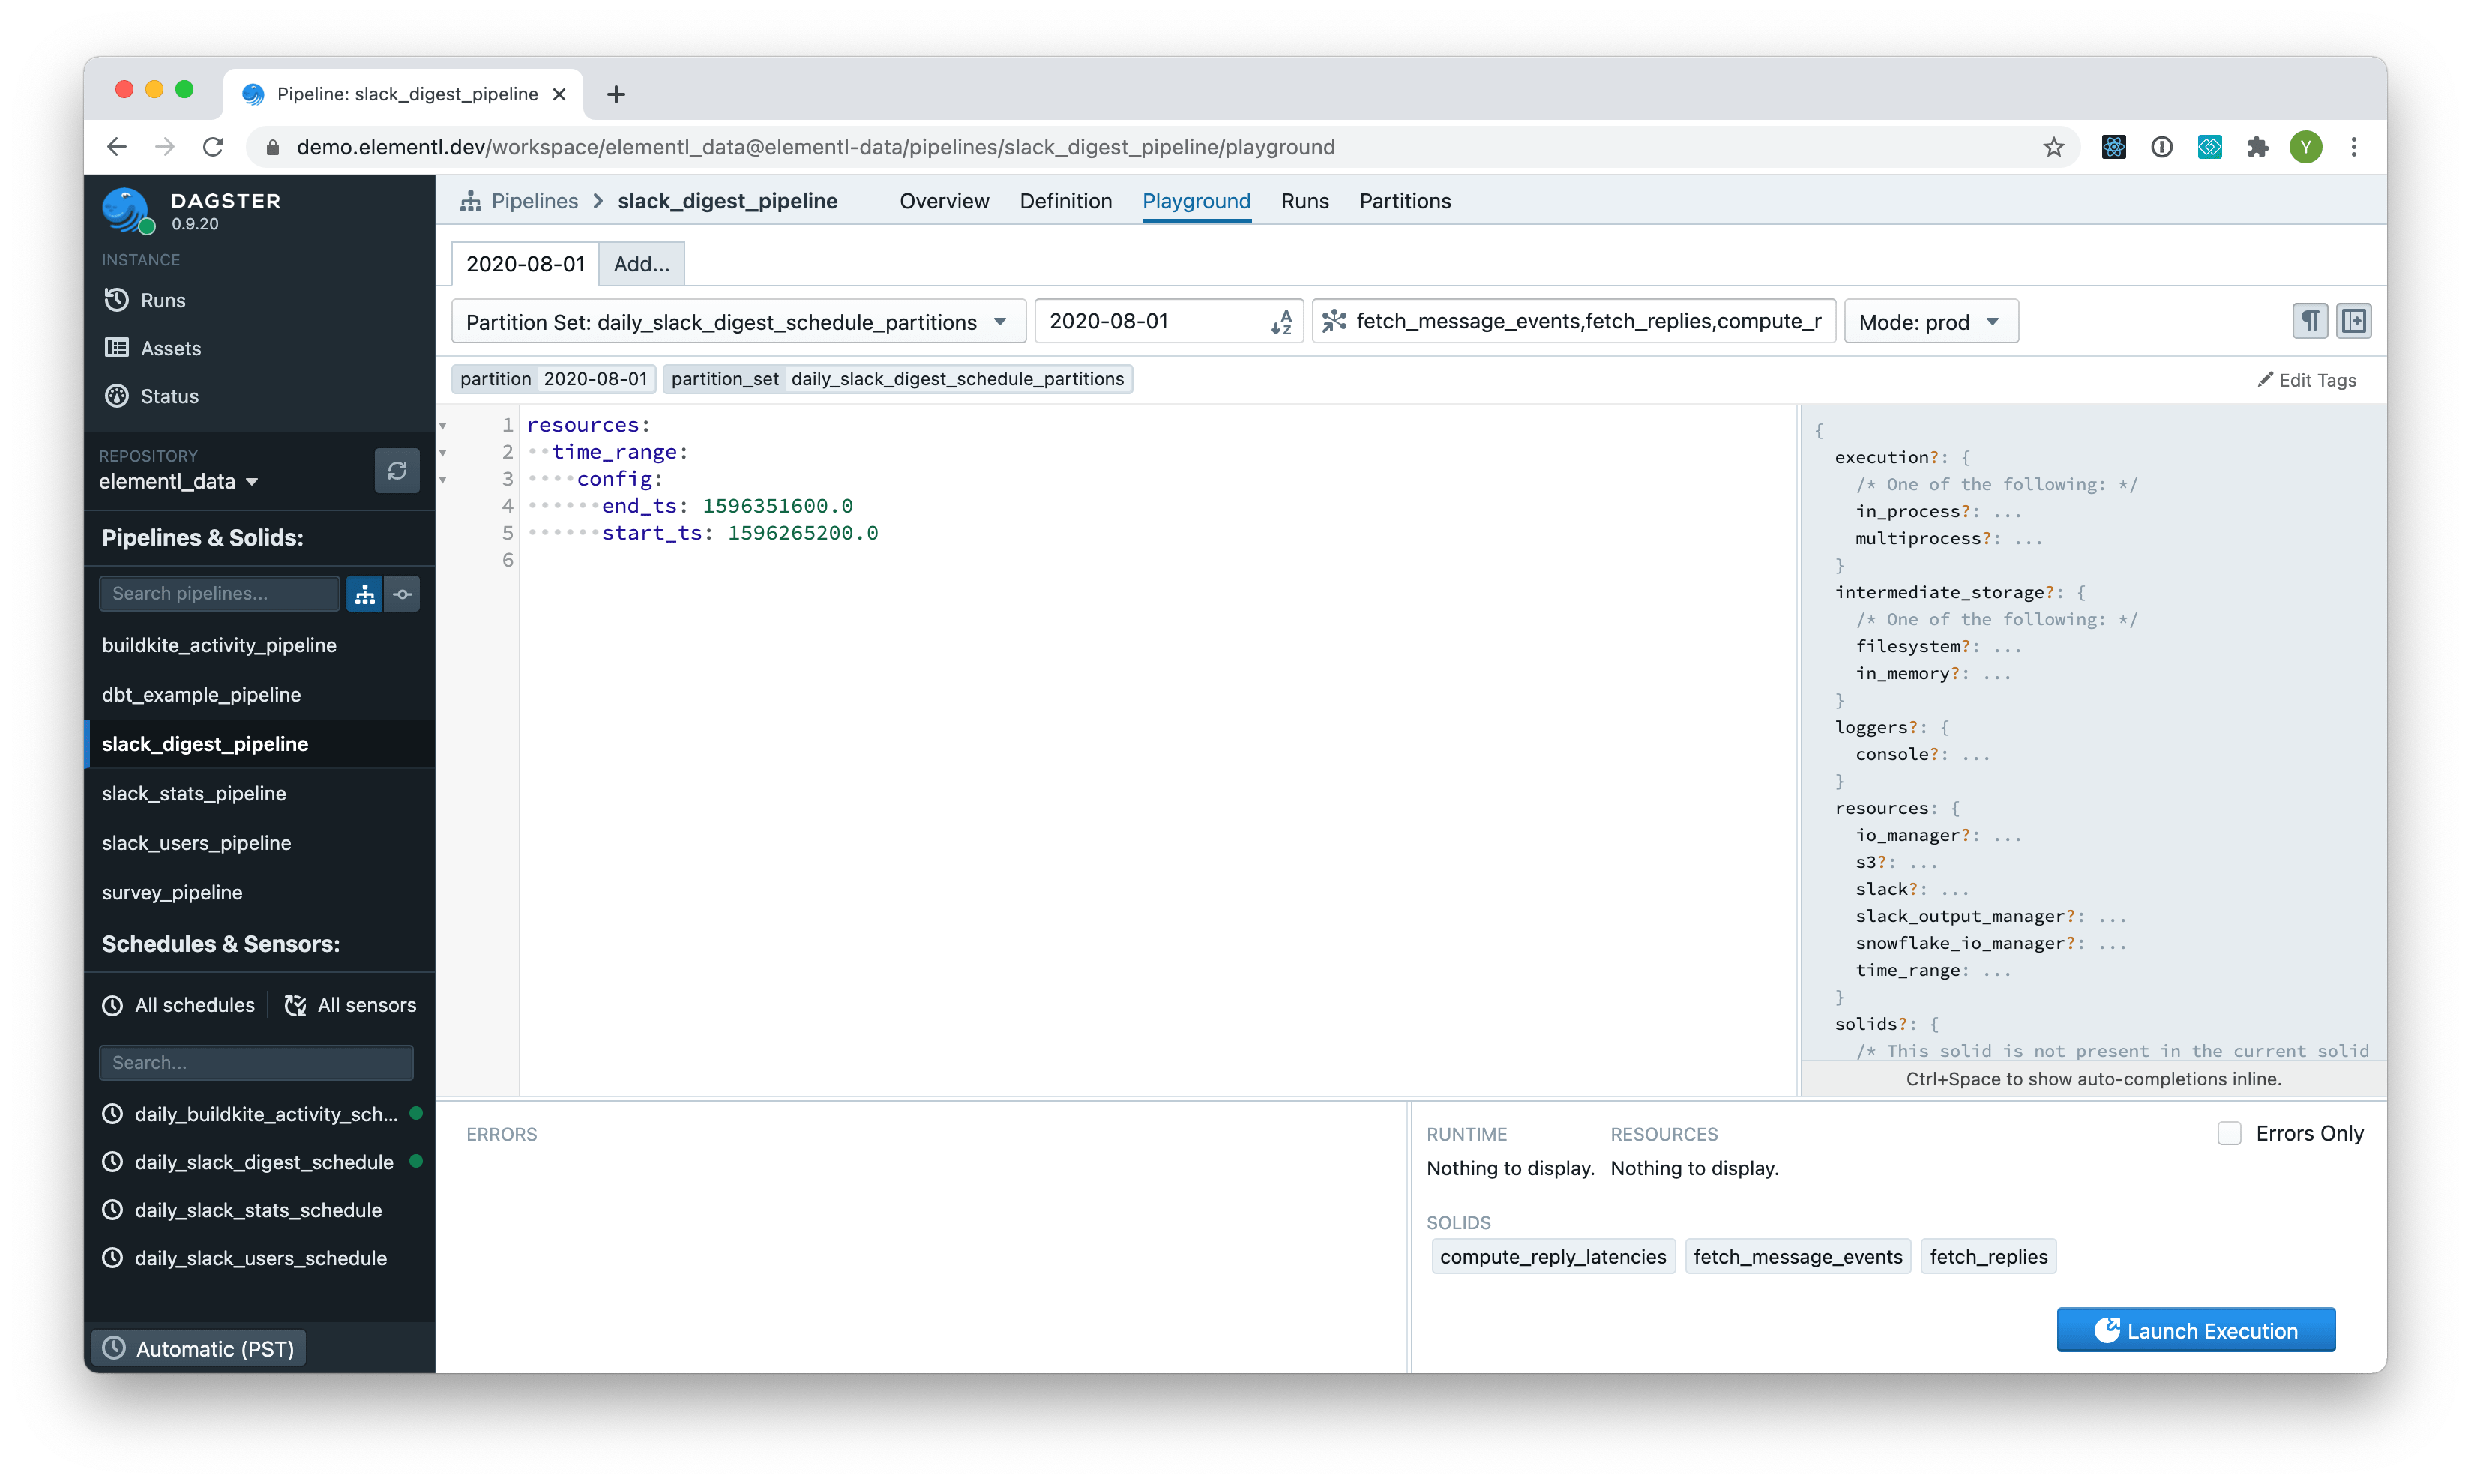
Playground#
The Playground tab in the pipeline page lets you experiment with configuration and launch runs. You can select from the set of presets for the pipeline, or type in your own configuration in the editor.
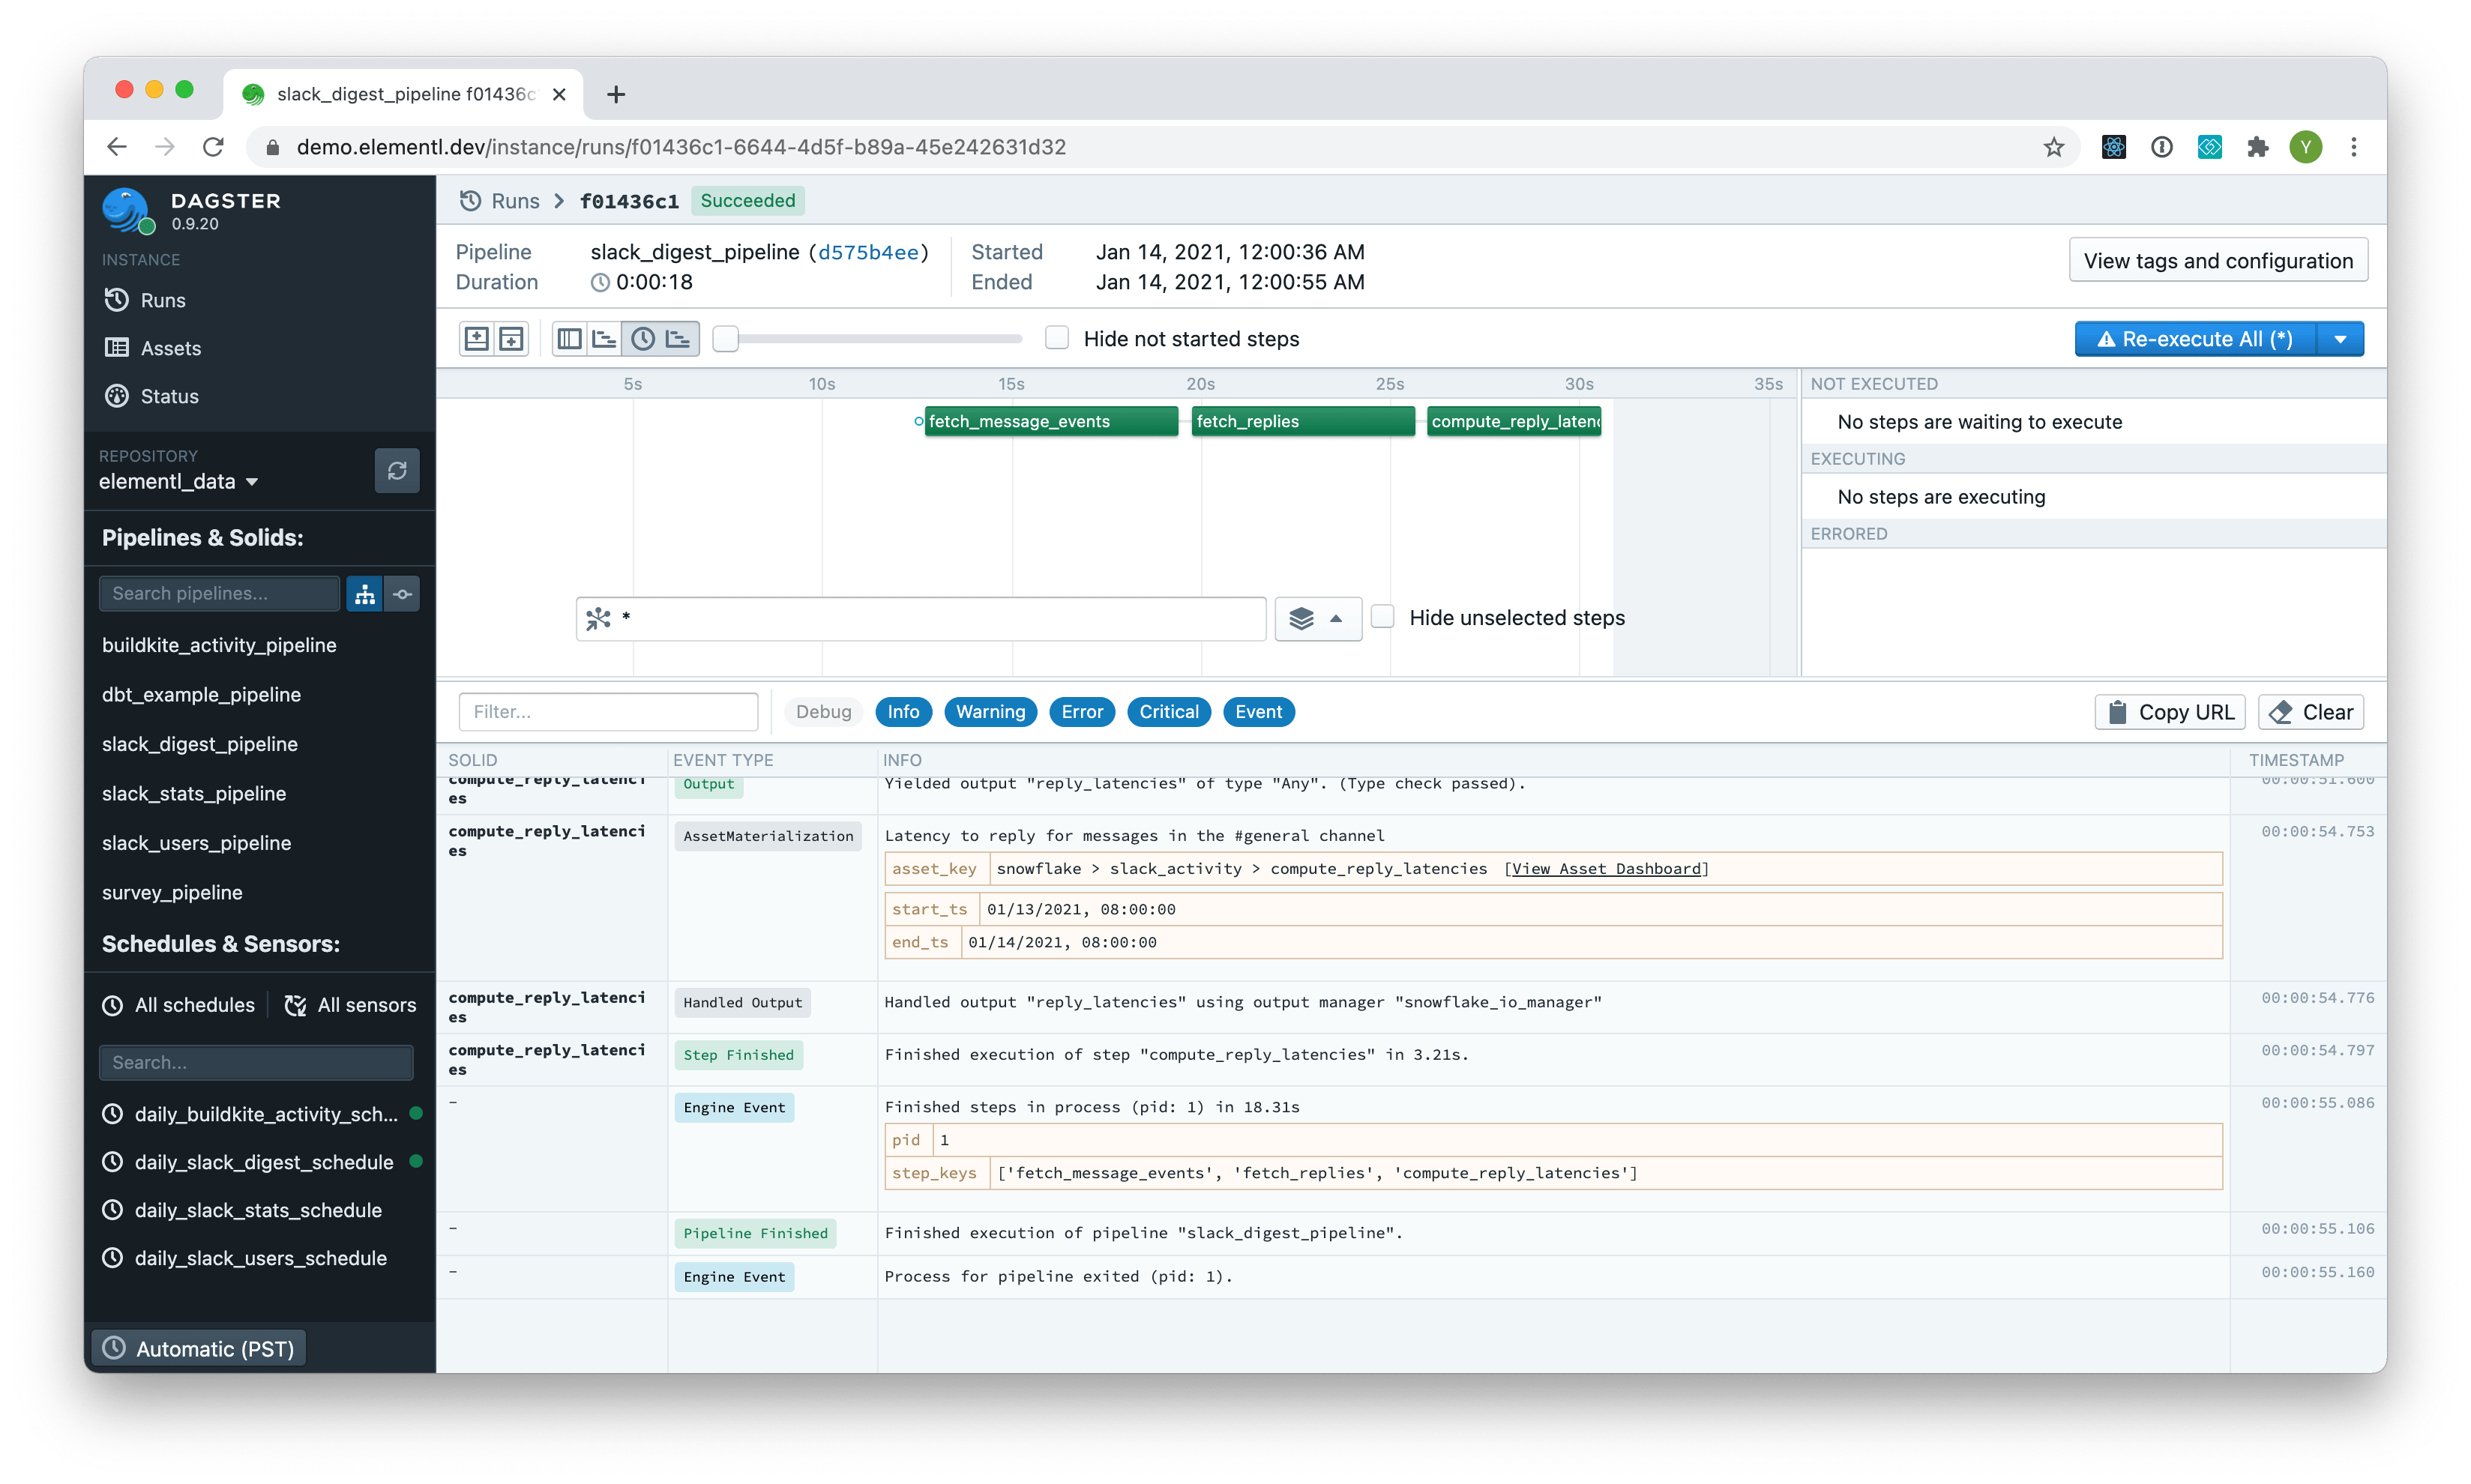
Run#
The Run tab in the pipeline page lets you see what happened within a single pipeline run. The upper left pane contains a Gantt chart, indicating how long each solid took to execute. The bottom pane shows events and logs emitted during the course of execution. The "Launch Re-execution" button lets you kick off a new run with the same configuration as the displayed run.
Solid#
The Solid page lets you see detailed information about a solid definition.
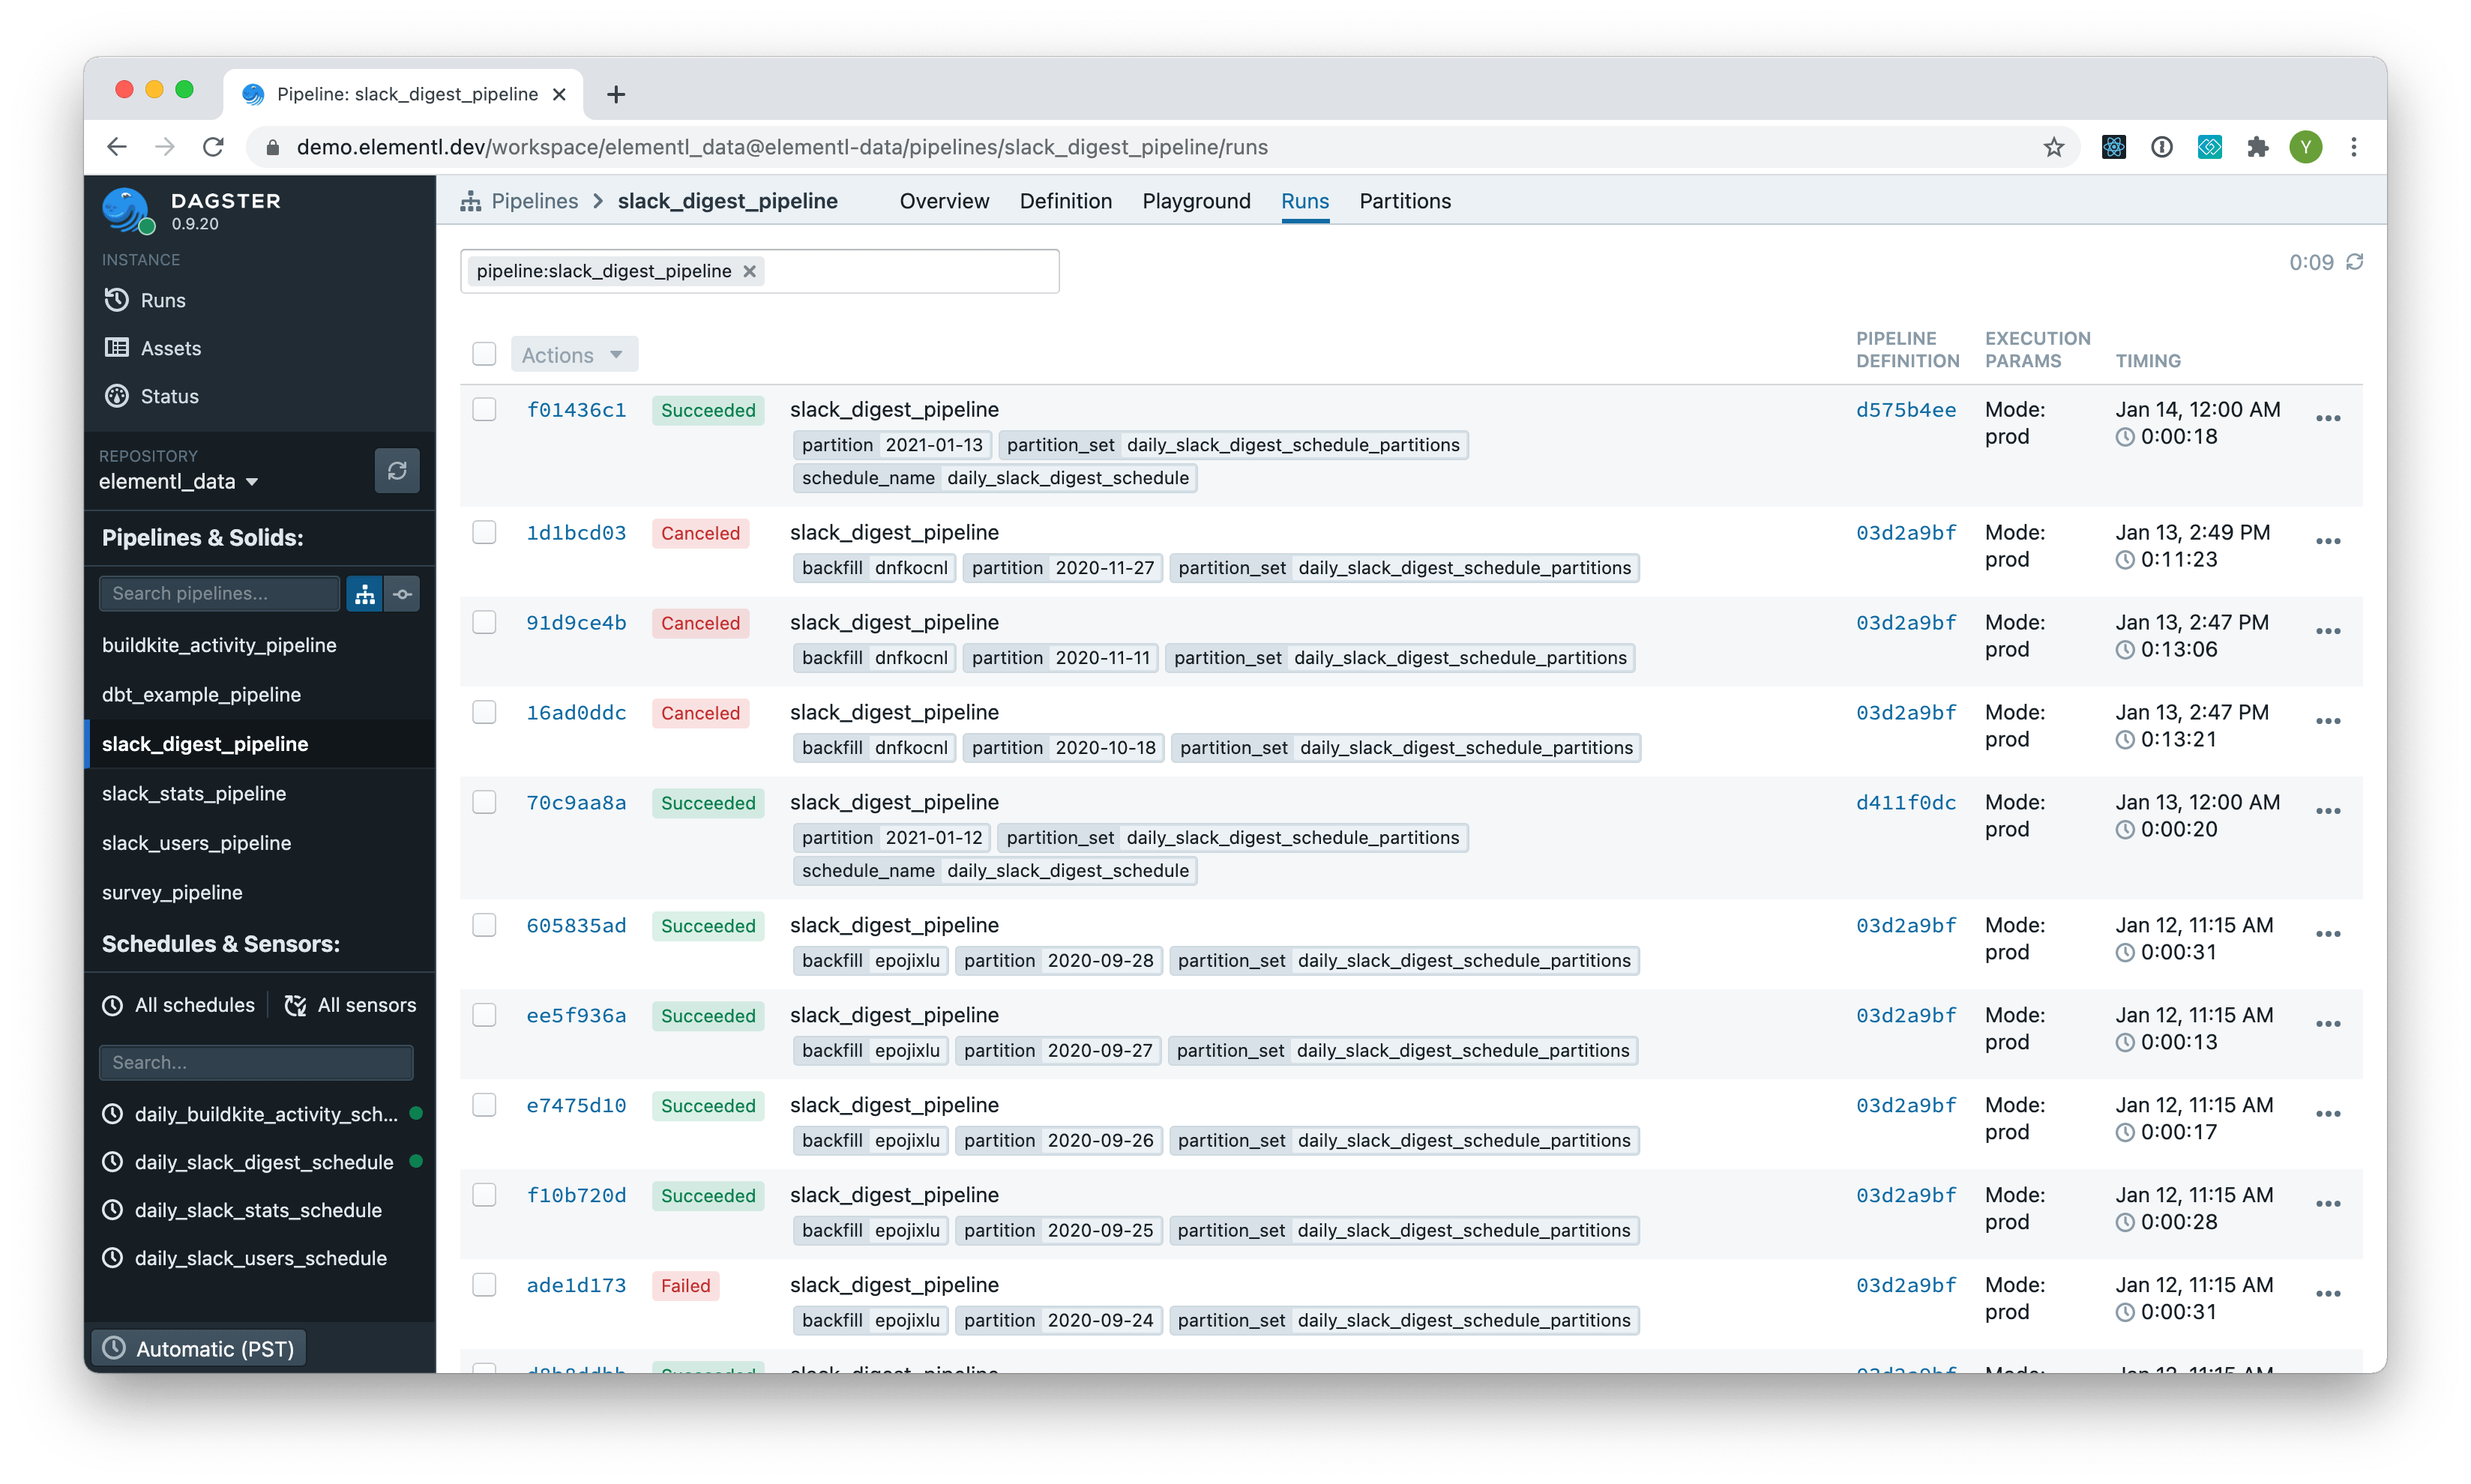
Runs#
The Runs page lists all pipeline runs. You can filter the list by pipeline name, run ID, execution status, or pipeline tag.
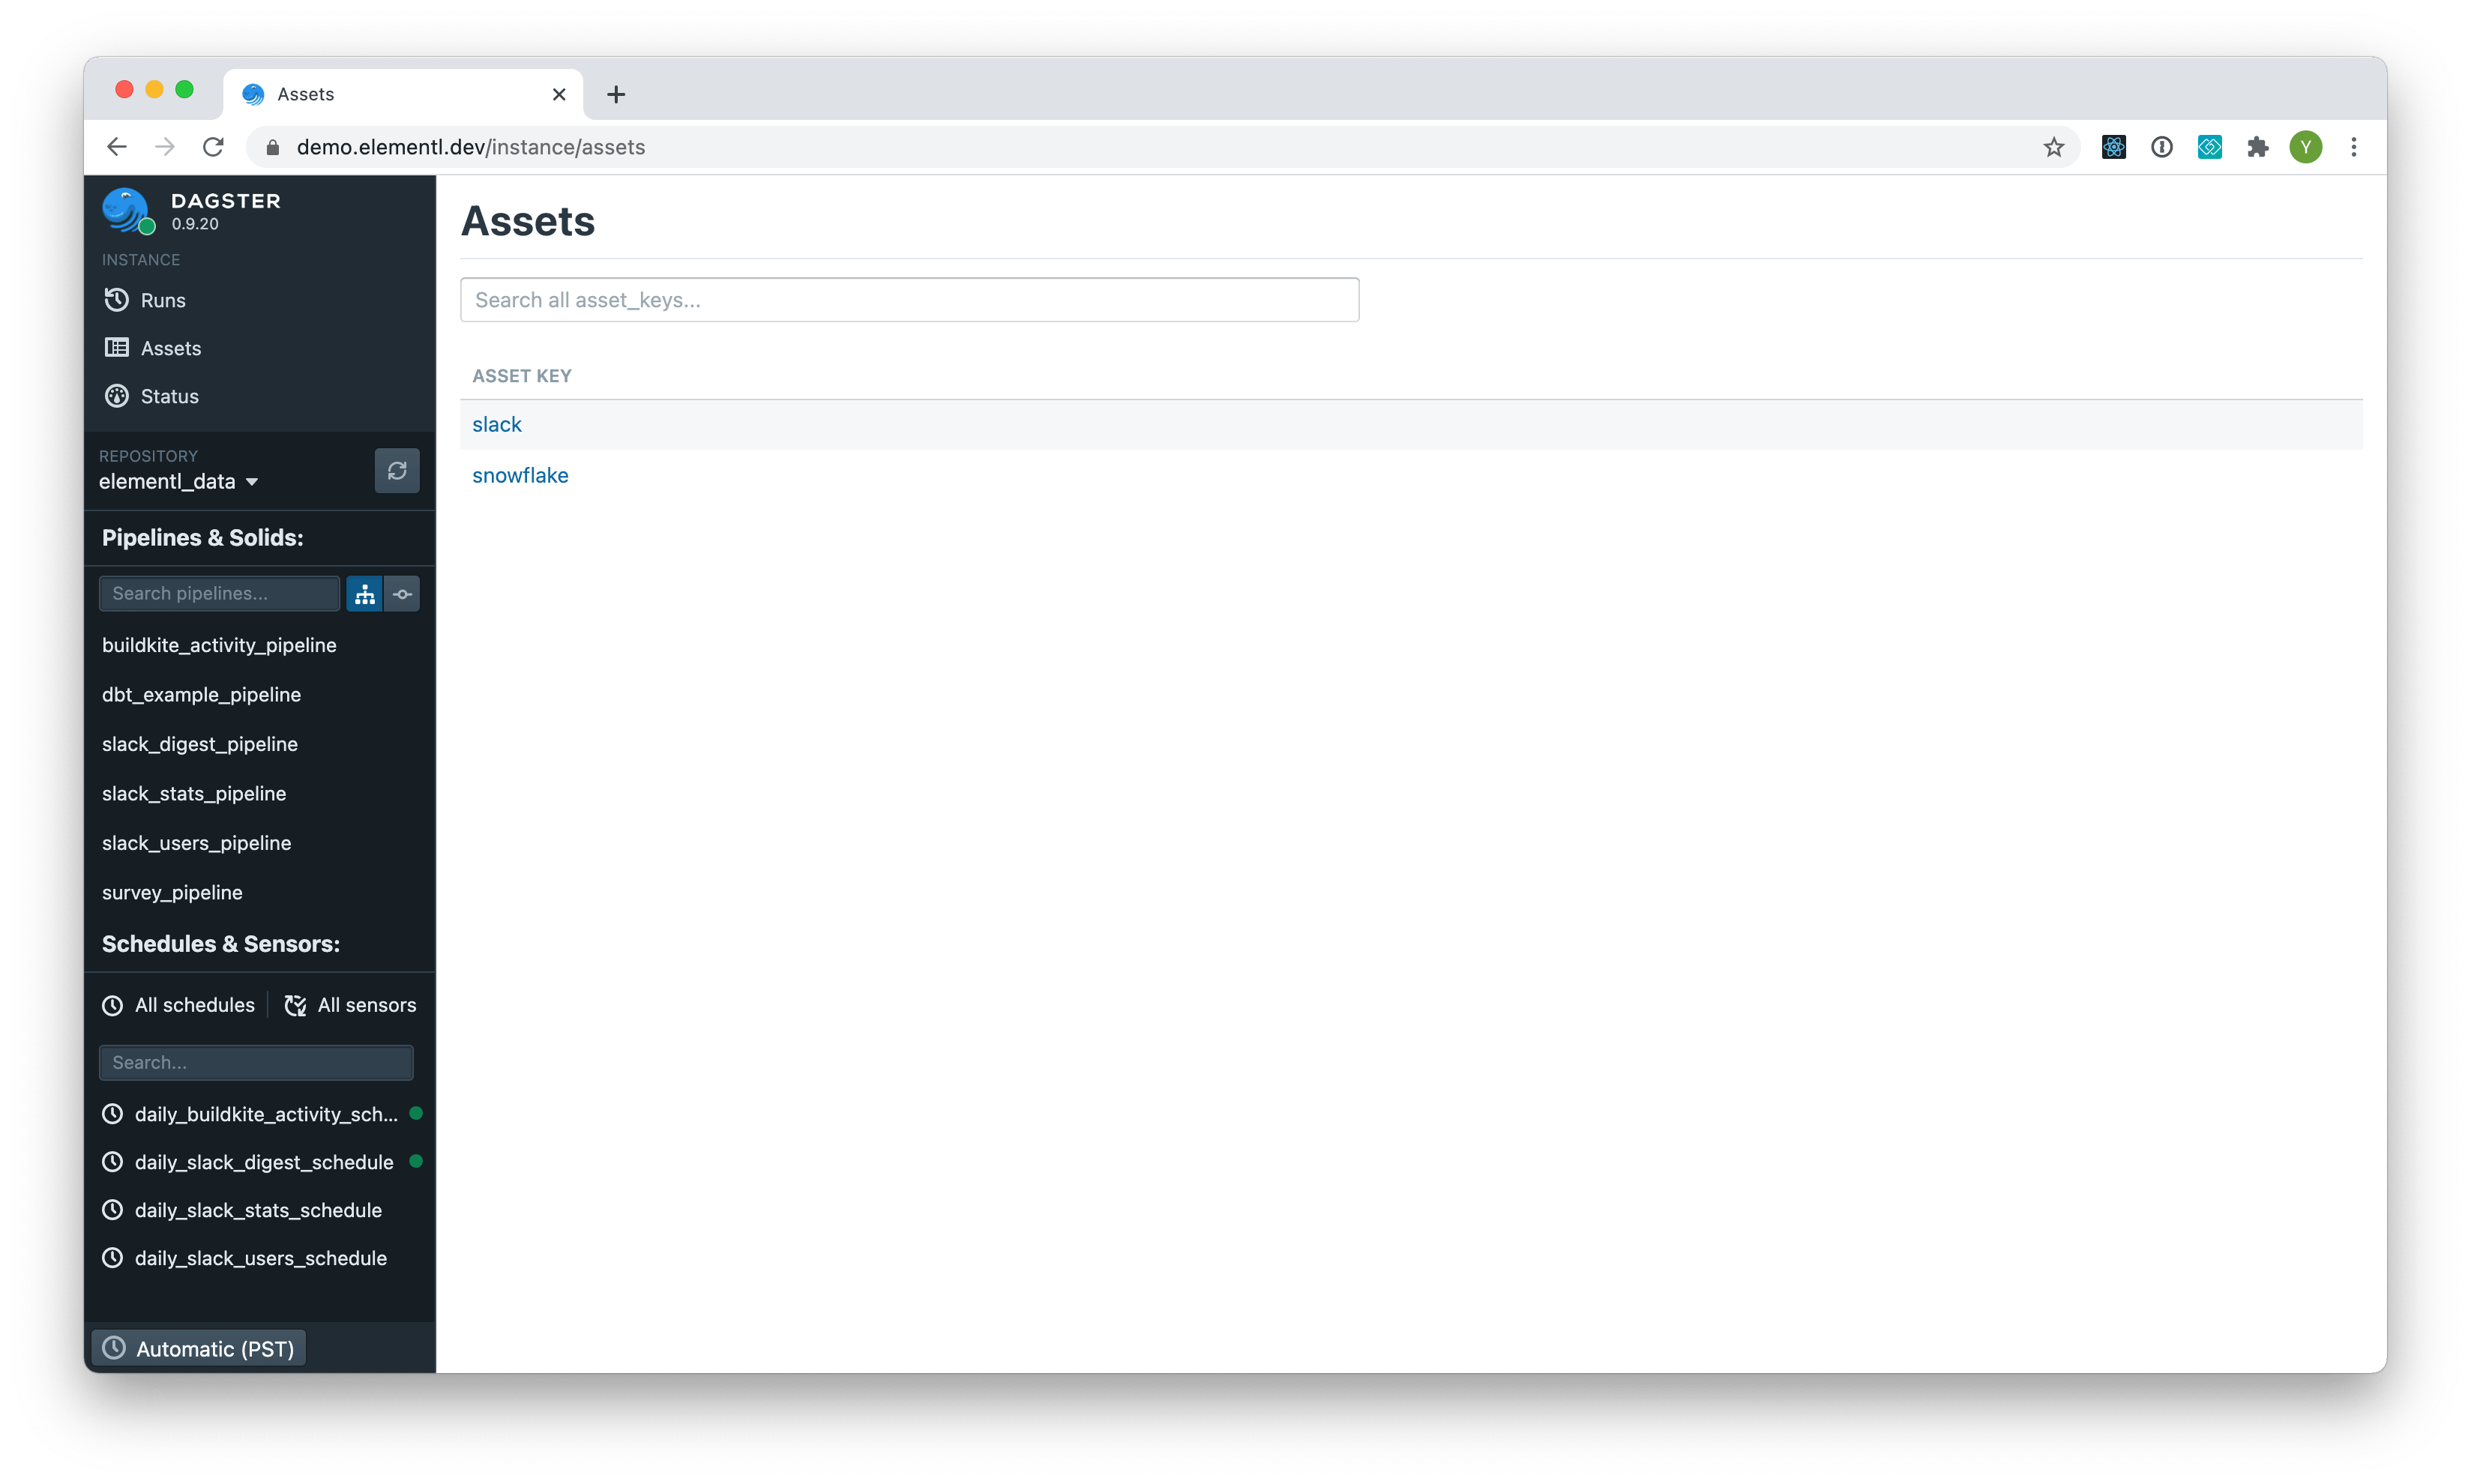
Assets#
The Assets page lists all assets. You can filter the list by asset key.
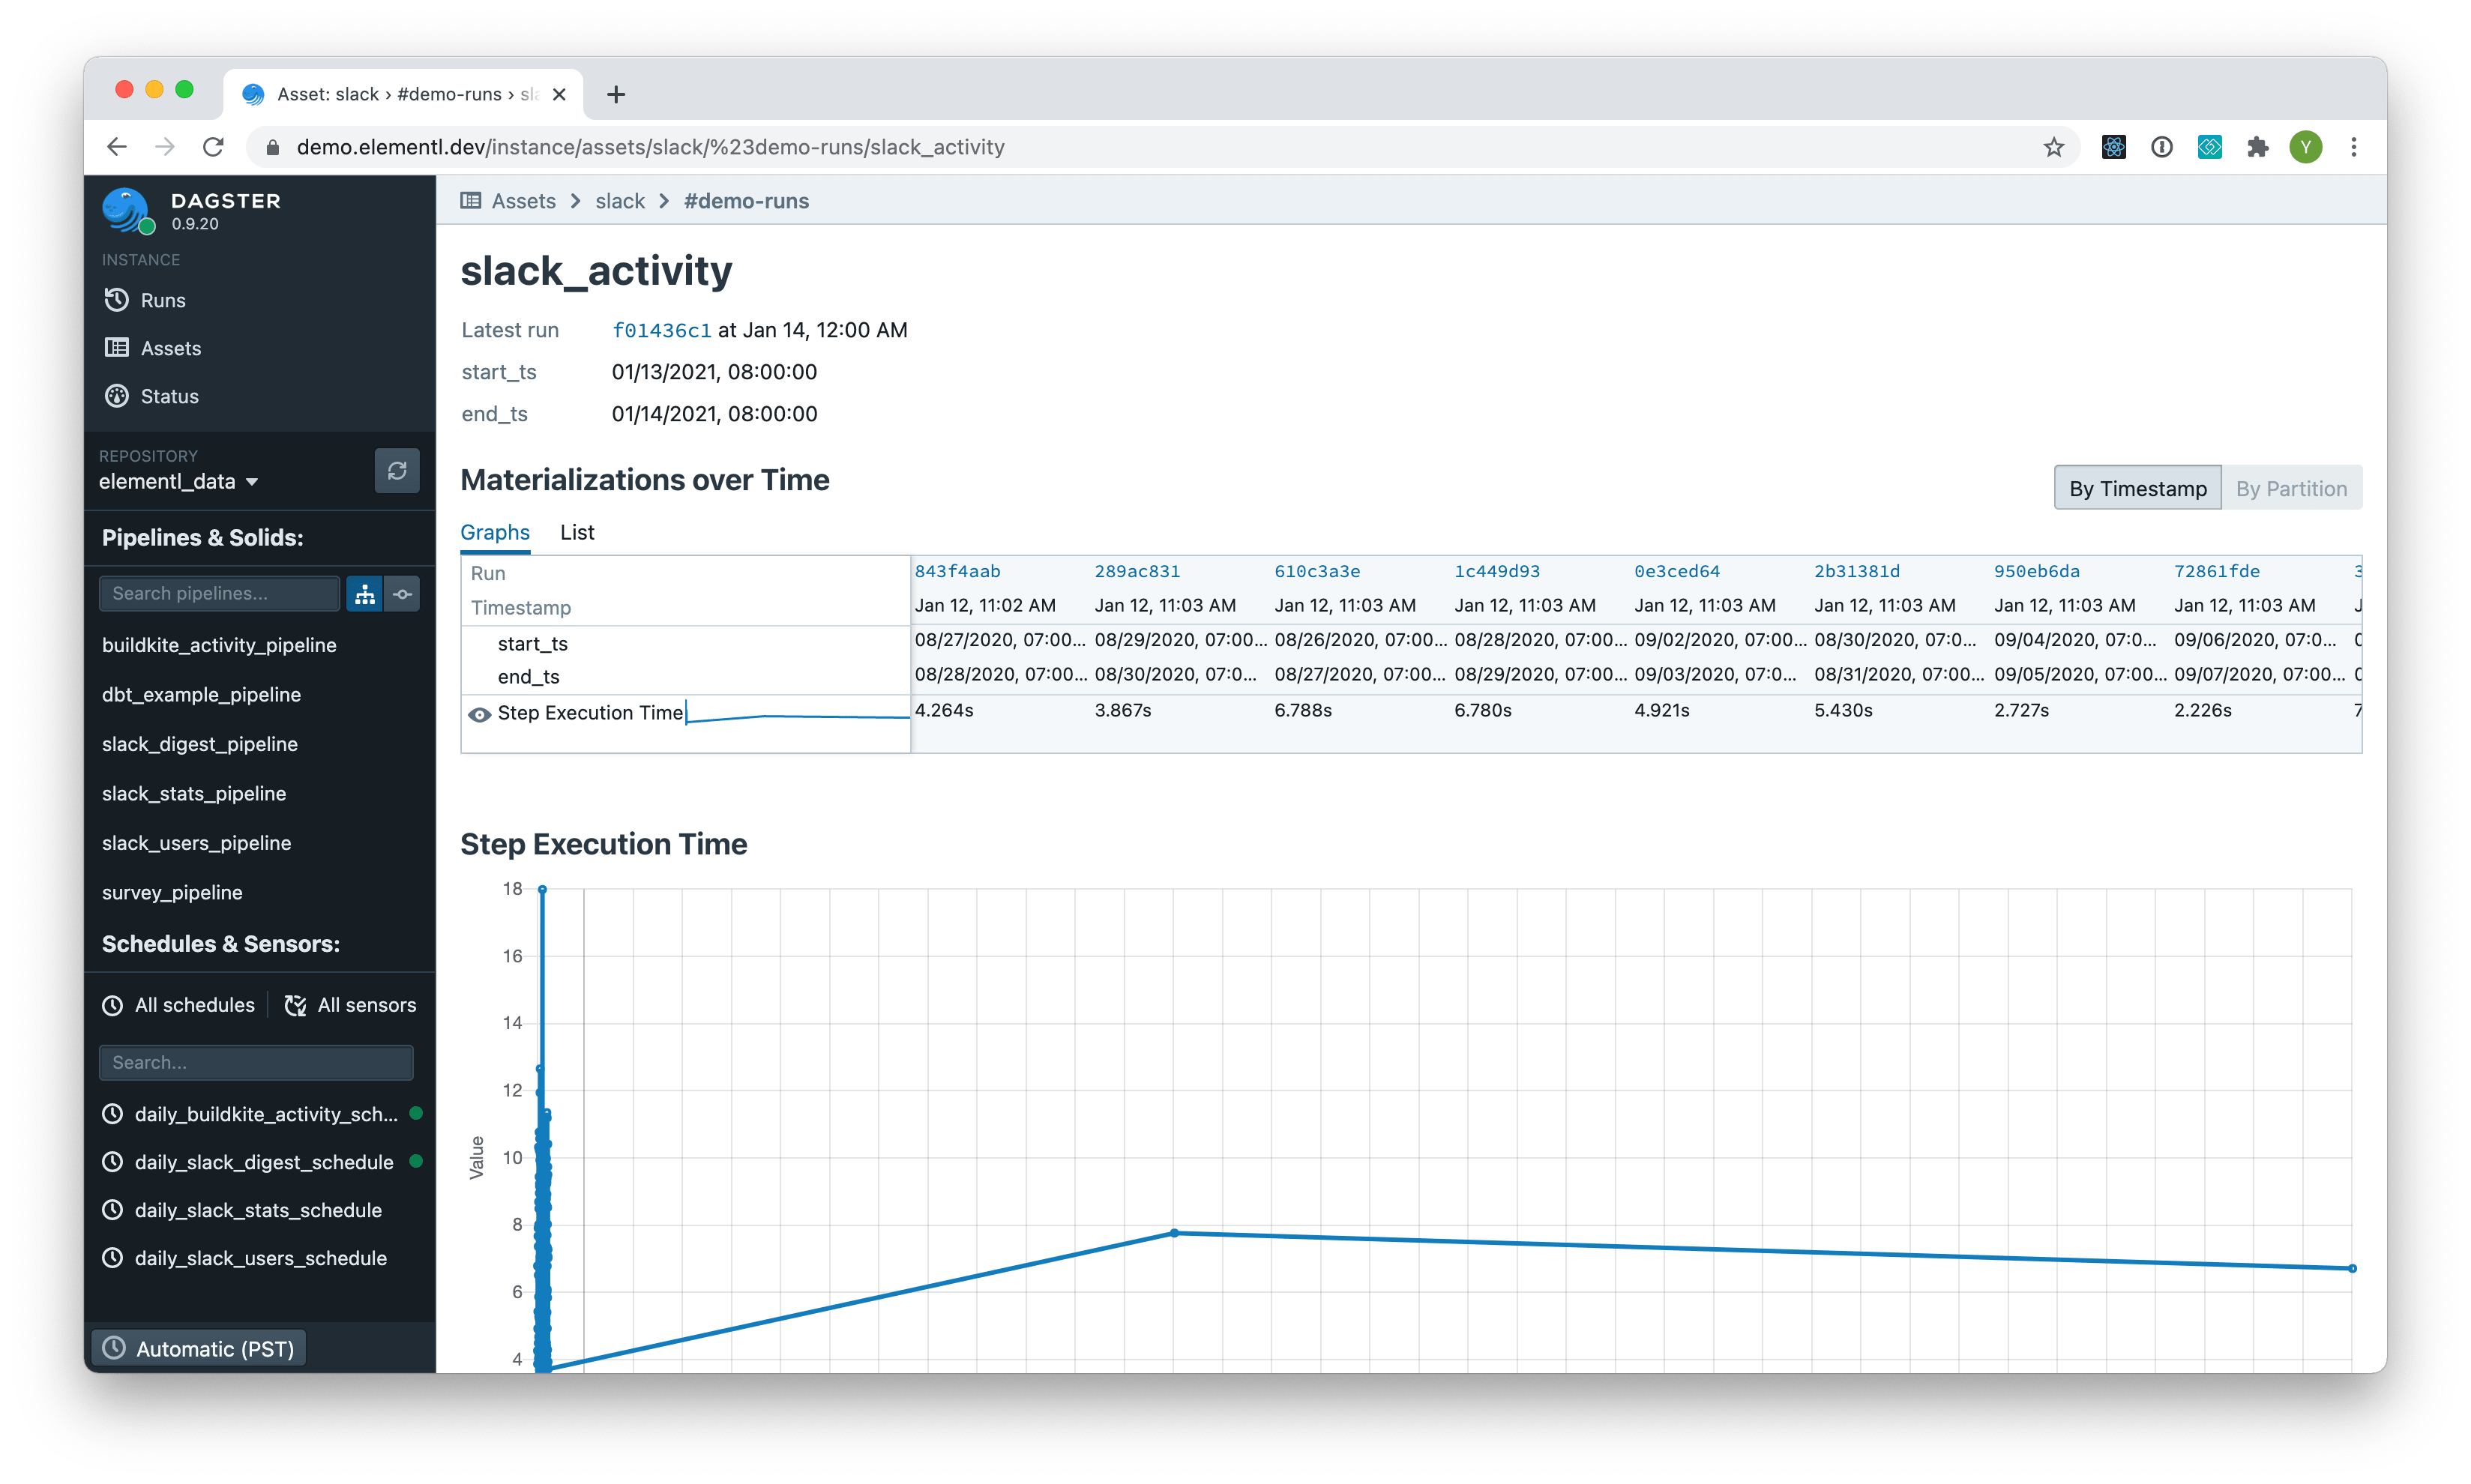
Asset#
The Asset page lists details about a single asset.
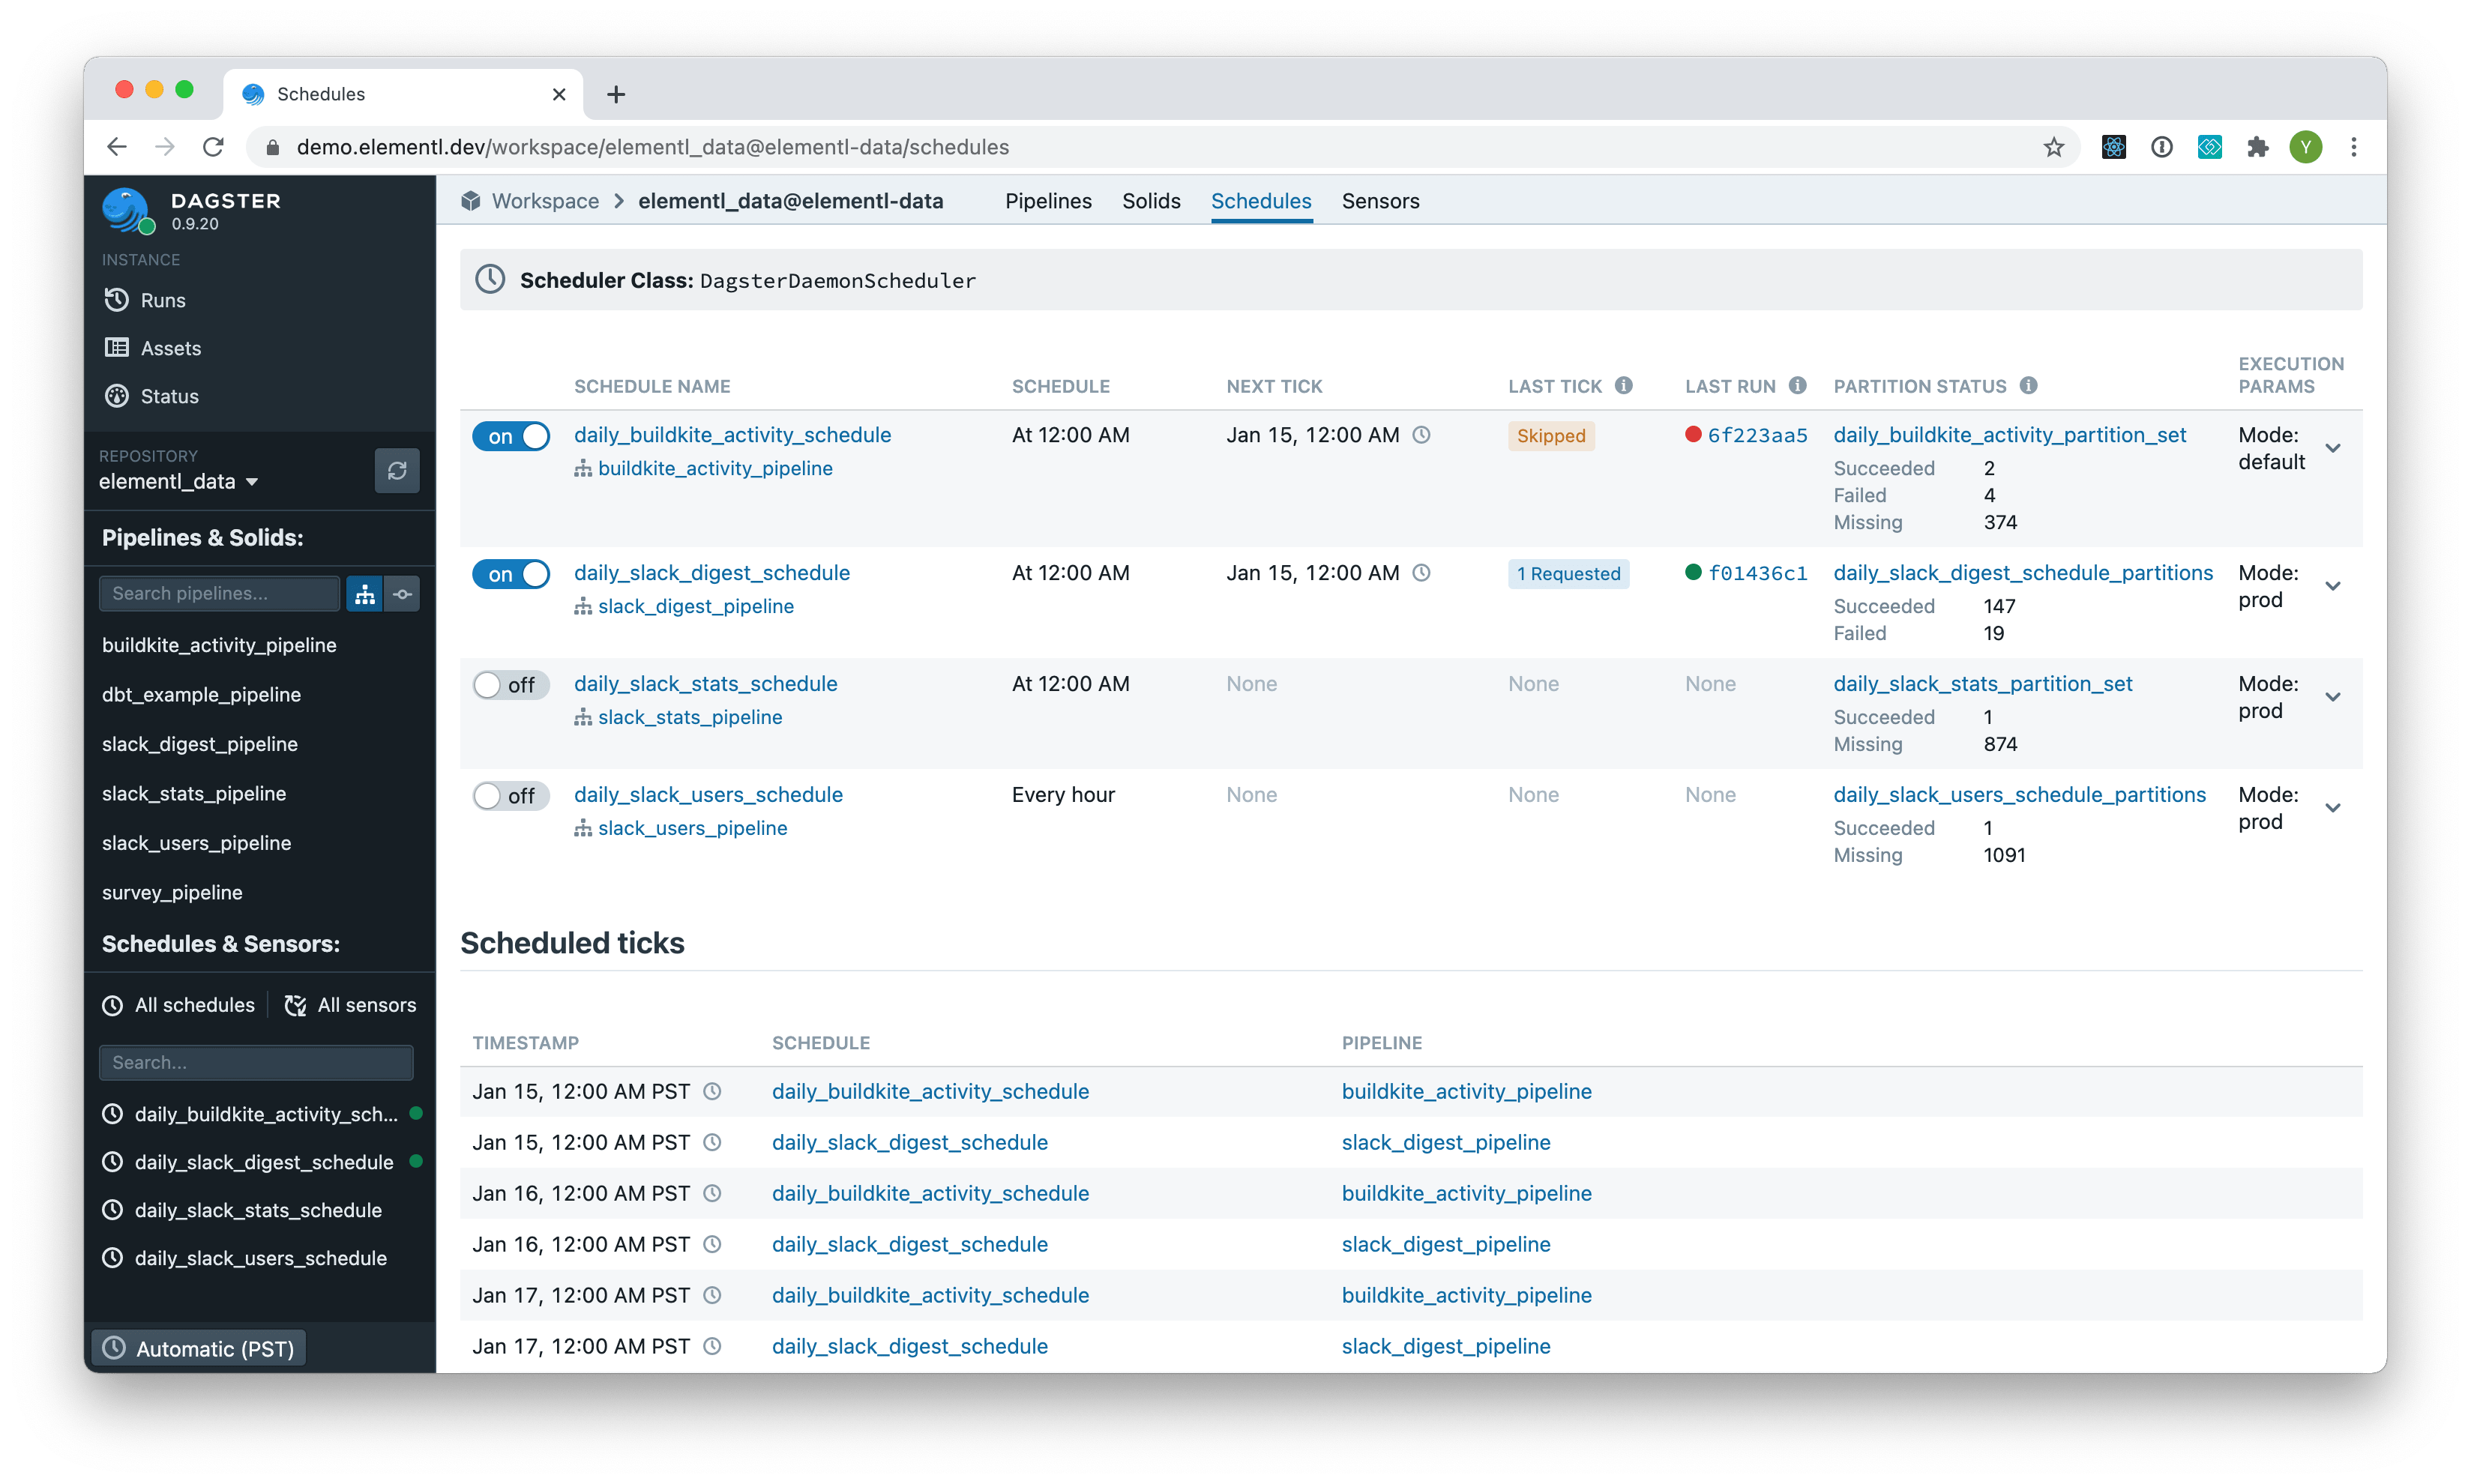
Schedules#
The Schedules page lists all schedules.
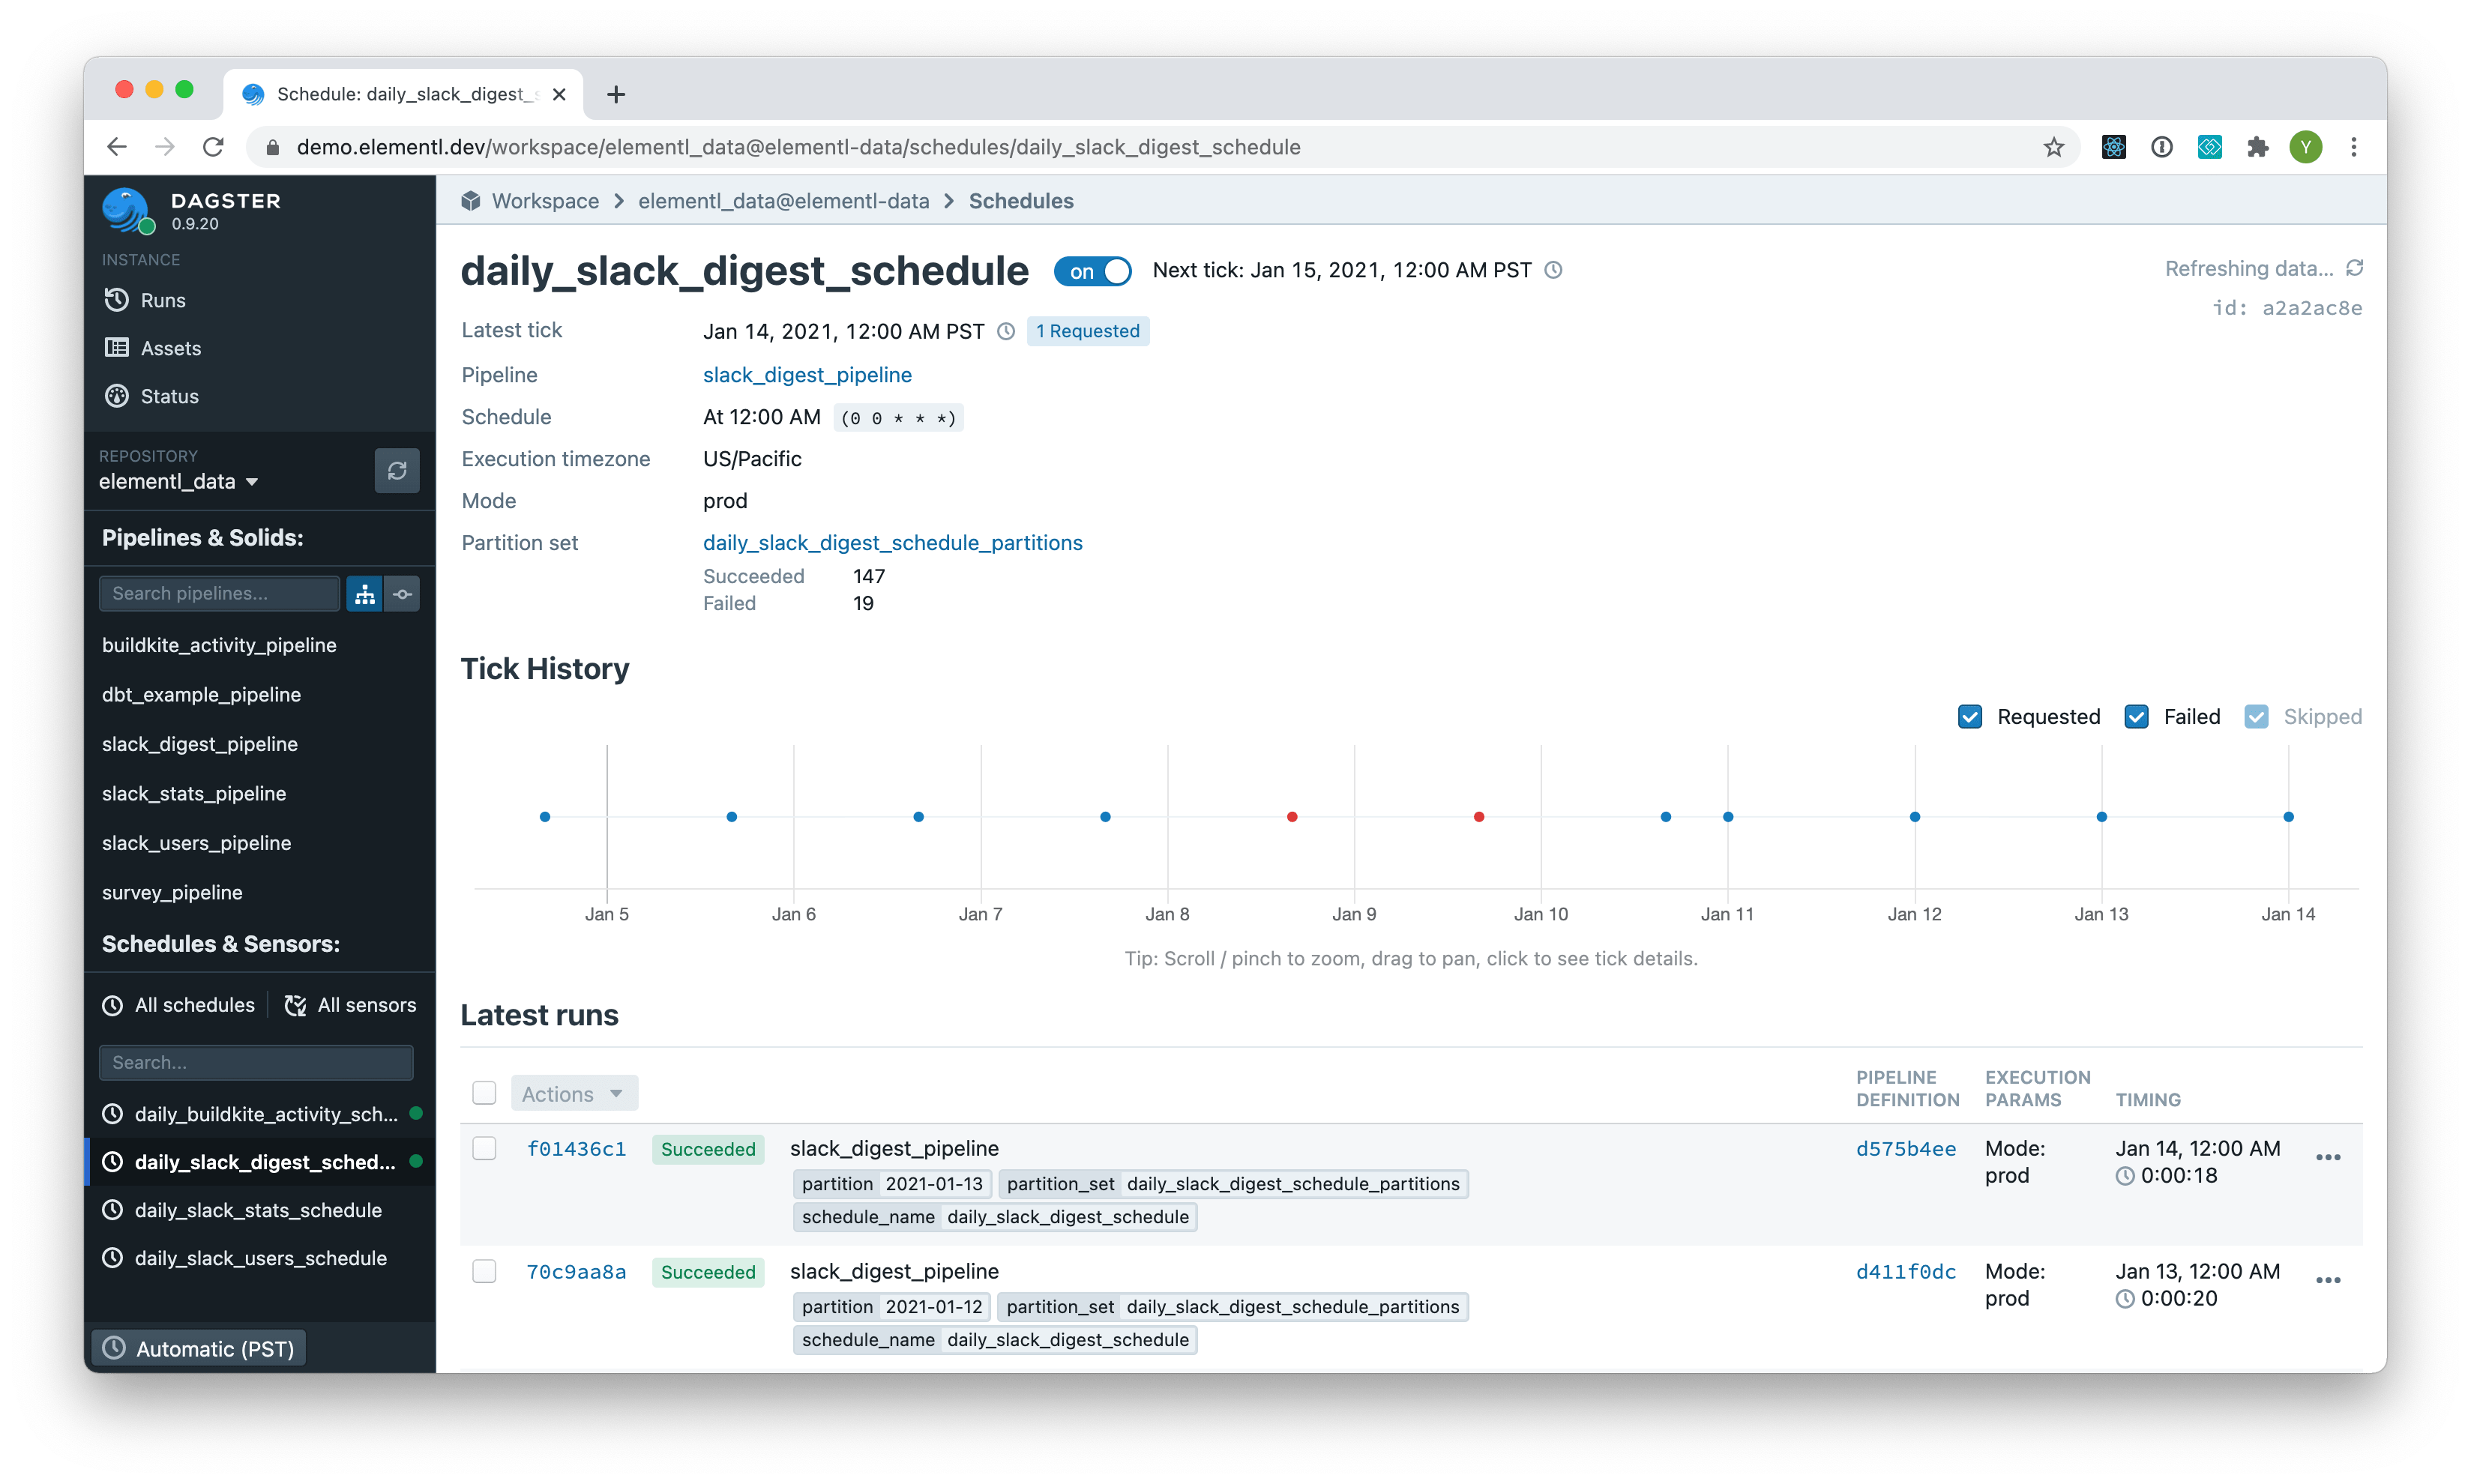
Schedule#
The Schedule page lists details about a single schedule.
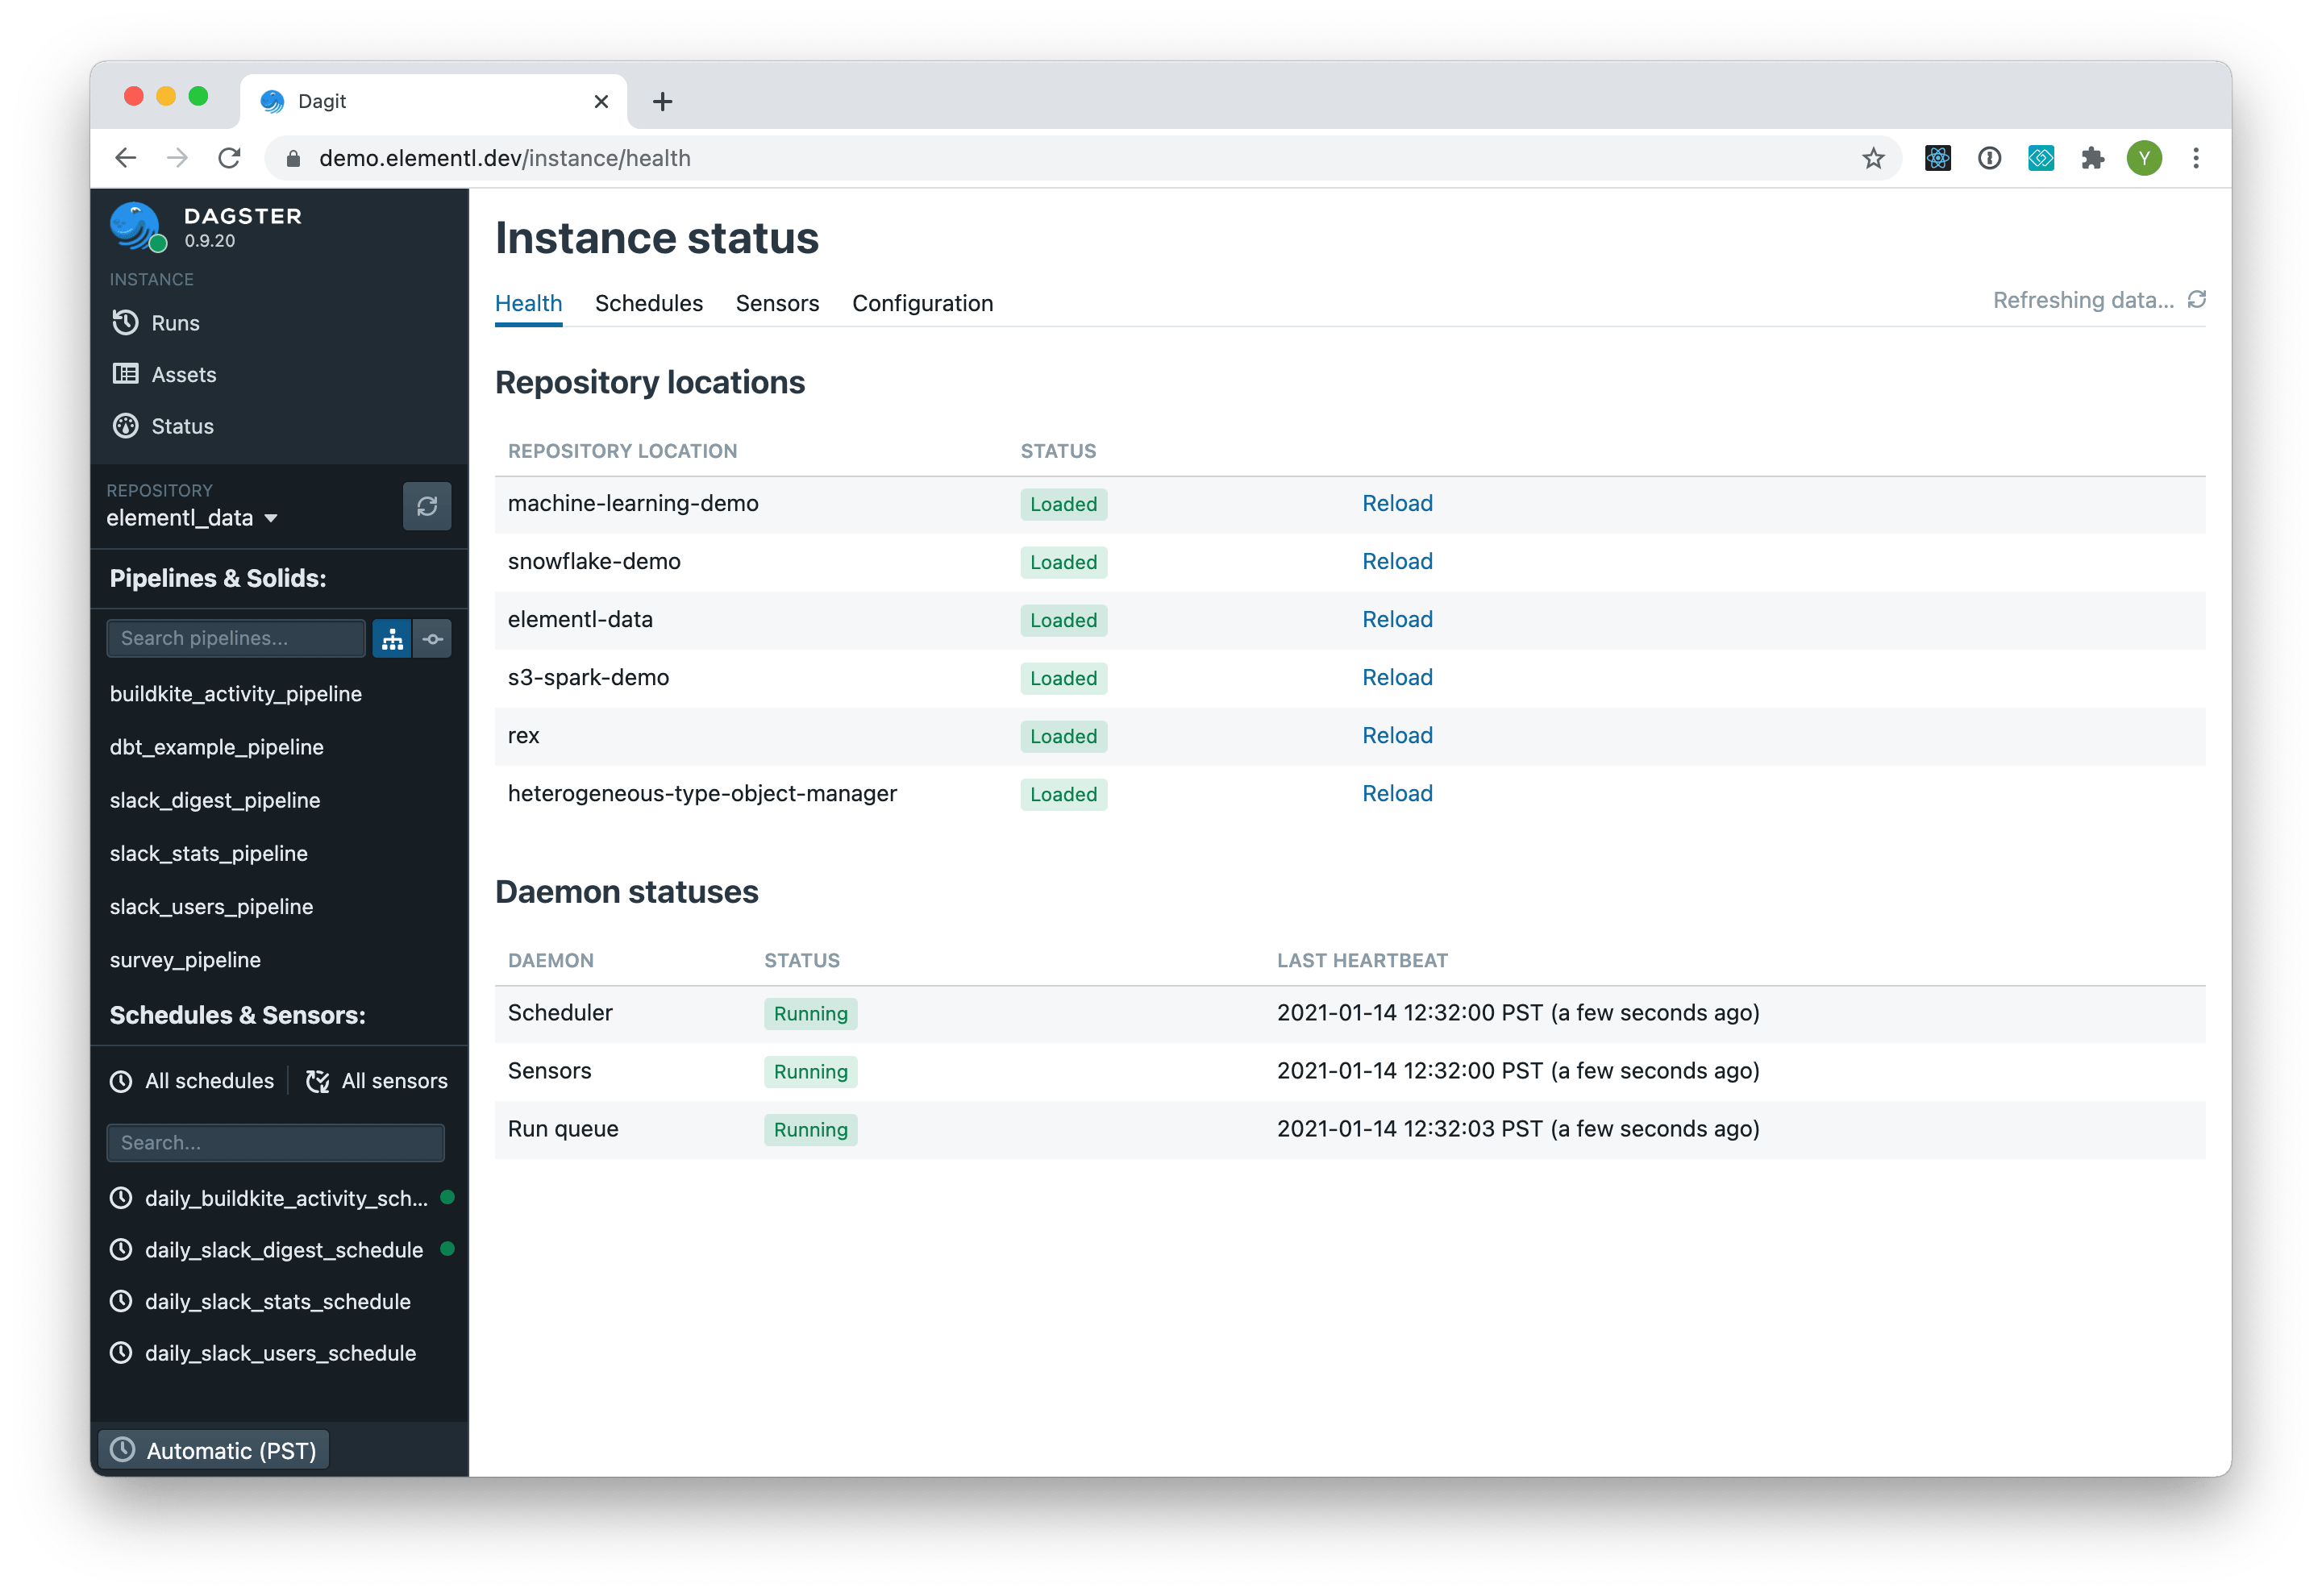
Status#
The Status page lists details about the instance configuration and the status of instance health, schedules, sensors, and more.